
Indicator

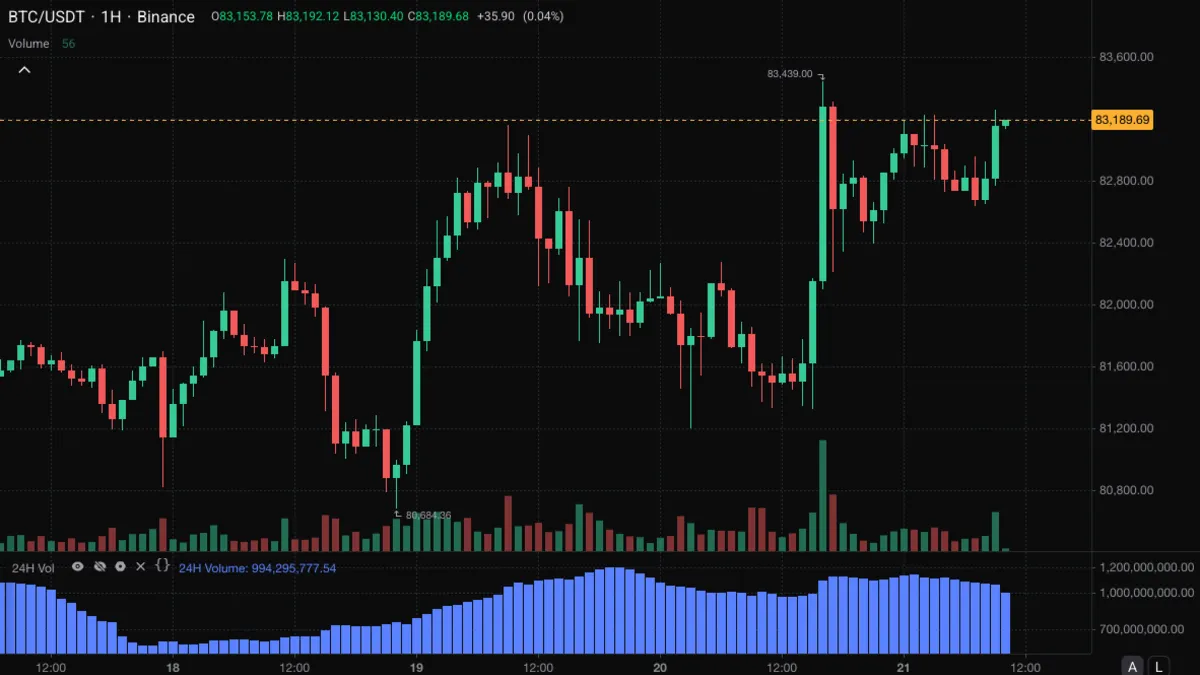
24-hour Volume
The turnover of the trailing 24 hours, summed from the chart's own bars, so you can follow daily activity at any intraday timeframe.
View indicator
Explore indicators and strategies. Understand the logic, inspect the code, and test ideas in Altrady Charts.
109 indicators
Indicator
The turnover of the trailing 24 hours, summed from the chart's own bars, so you can follow daily activity at any intraday timeframe.
View indicator
Indicator
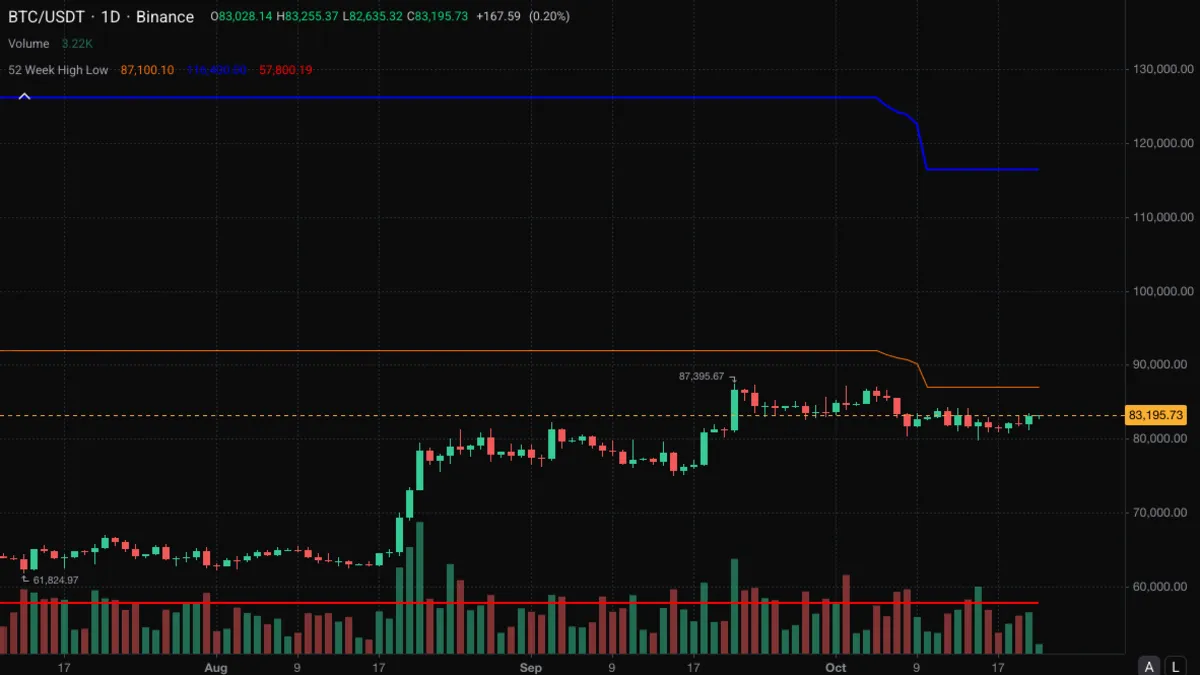
The highest high and lowest low of the last 365 bars with their midpoint, showing the year's range on a daily chart and where price sits inside it.
View indicator
Indicator
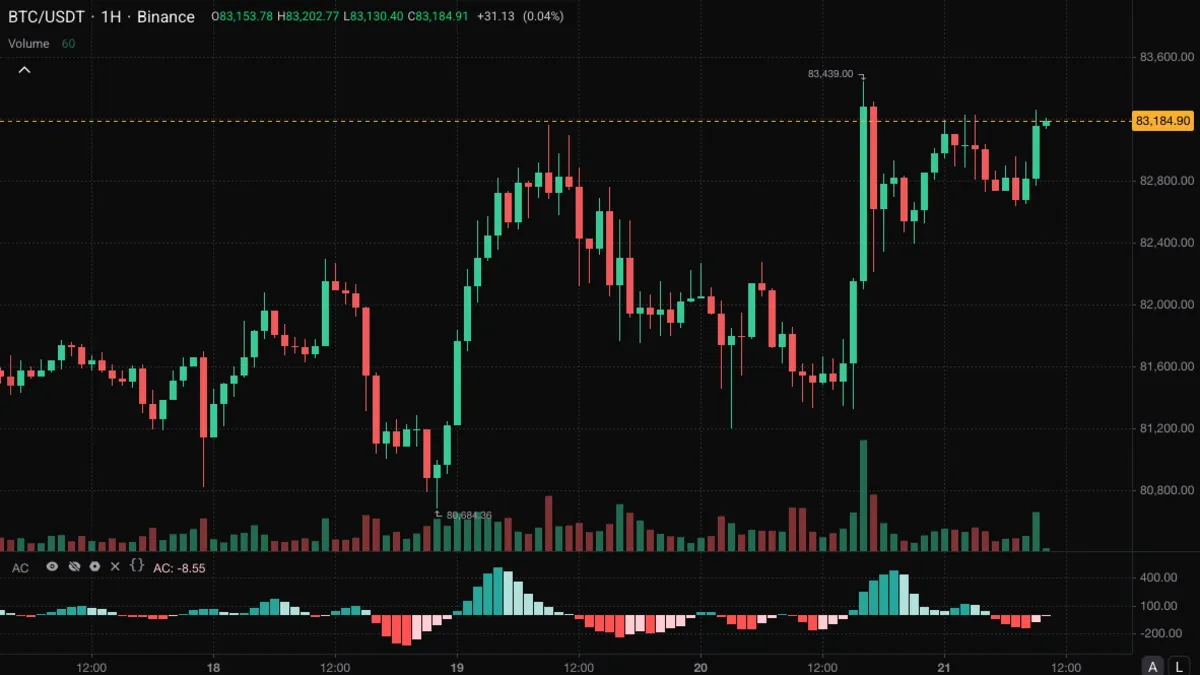
Shows whether momentum is speeding up or slowing down, measured as the Awesome Oscillator against its own short average.
View indicator
Indicator
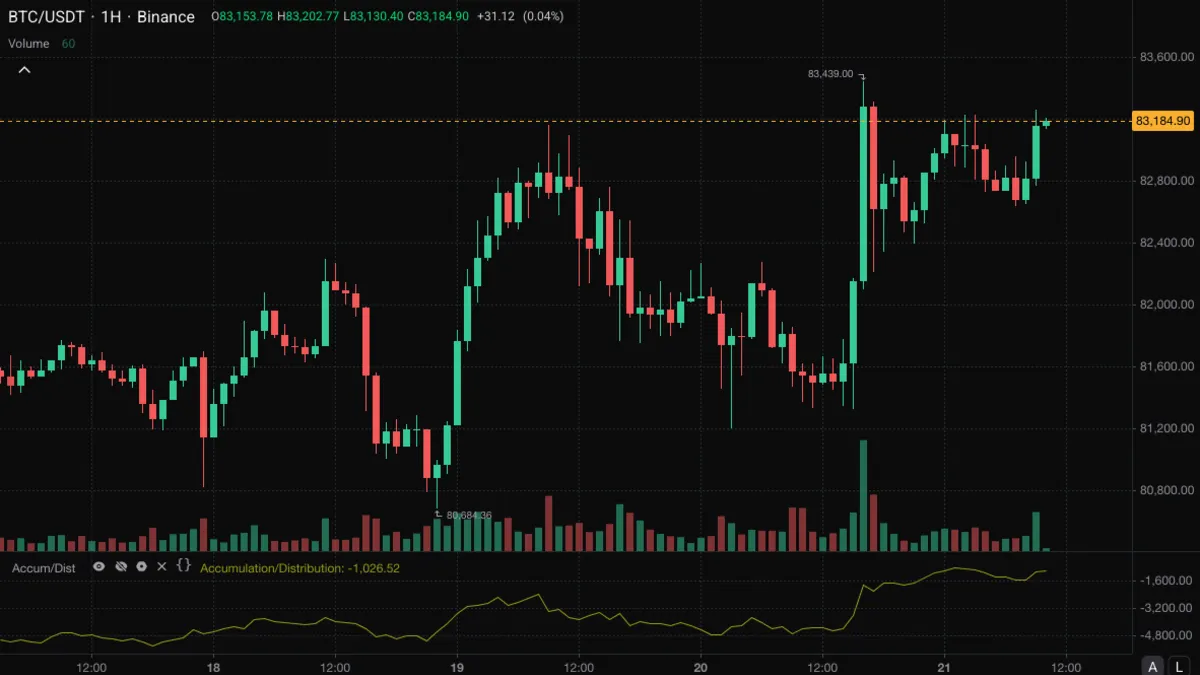
A running total of volume, weighted by where each bar closed inside its range, that shows whether buyers or sellers kept finishing the bar in control.
View indicator
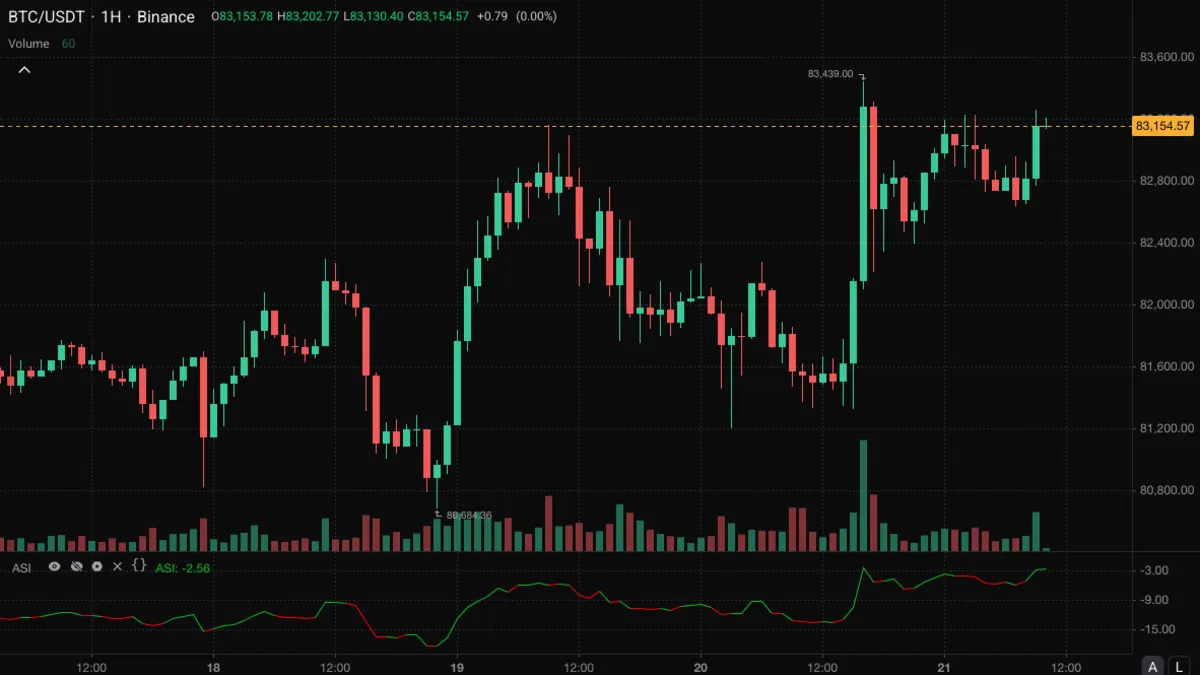
Indicator
A running total of Wilder's Swing Index, which follows the real swings in price and plays down the noise between them.
View indicator
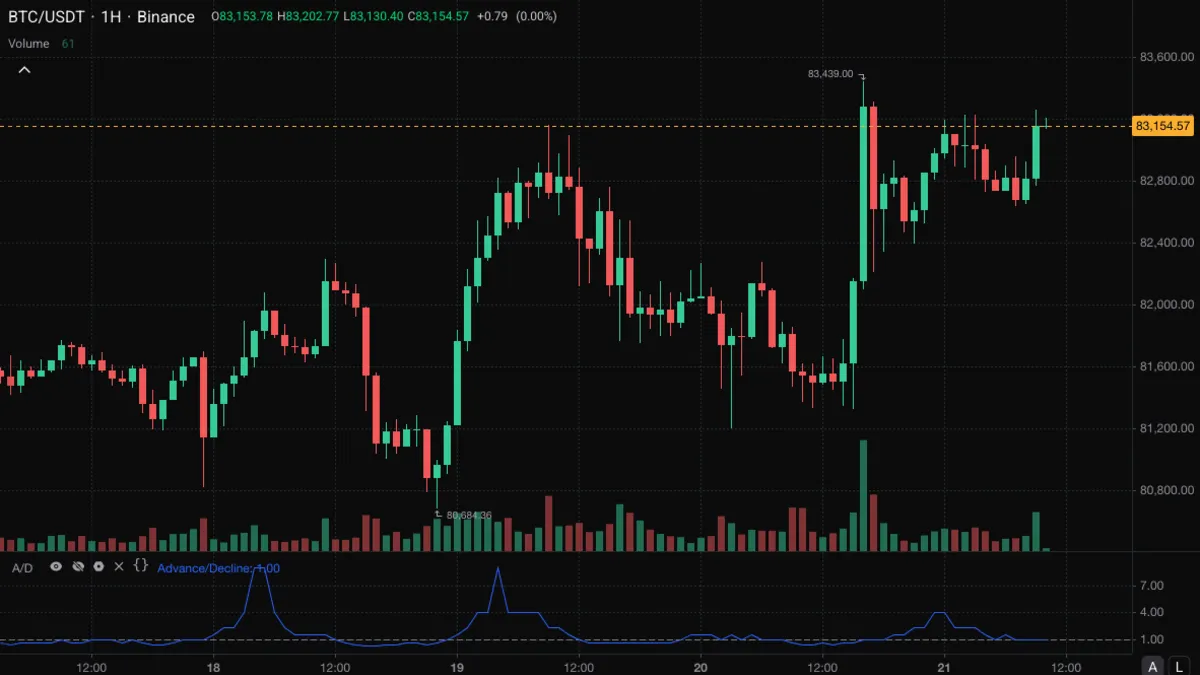
Indicator
The number of up bars divided by the number of down bars over a recent window on one market, showing whether rising or falling bars have dominated.
View indicator
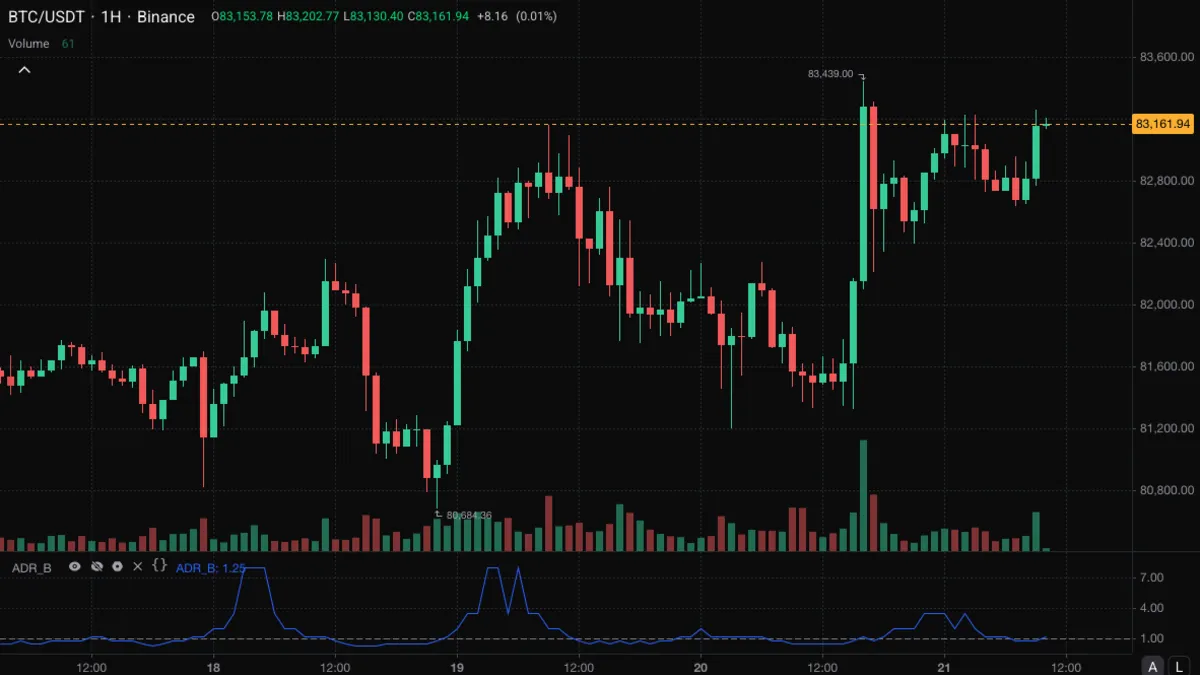
Indicator
The number of up bars divided by the number of down bars over a recent window on the chart, showing whether rising or falling bars have dominated.
View indicator
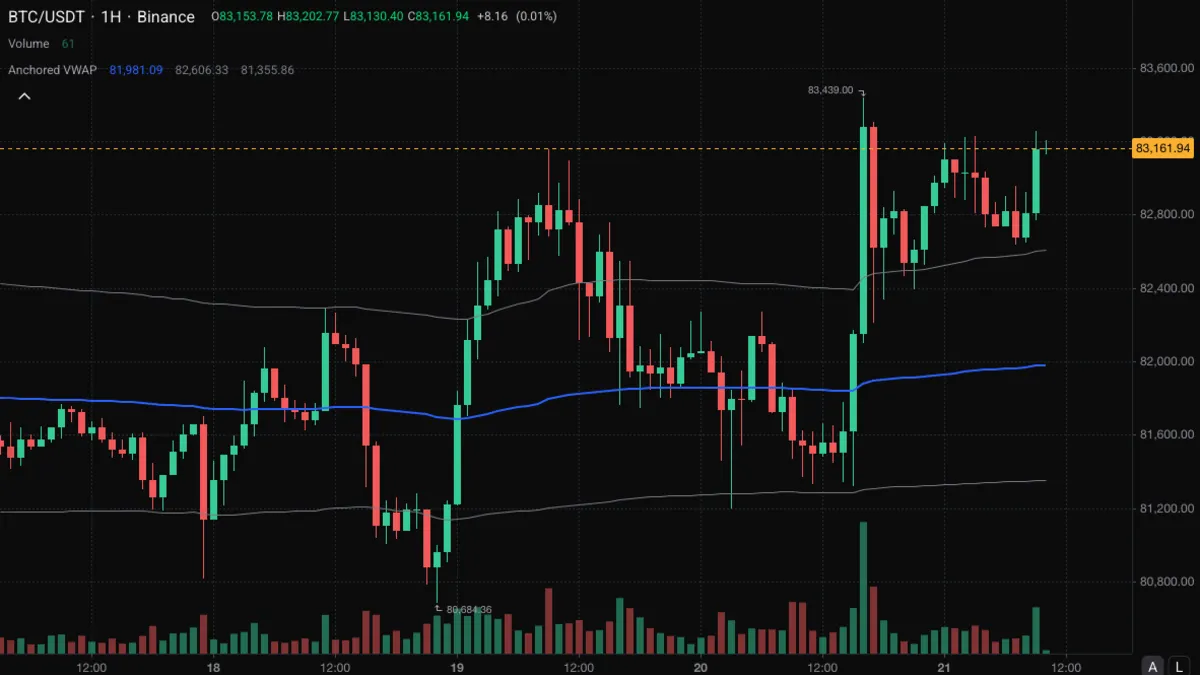
Indicator
The volume-weighted average price since the most recent swing low or high, with deviation bands, showing what buyers or sellers since that turn have paid on average.
View indicator
Indicator
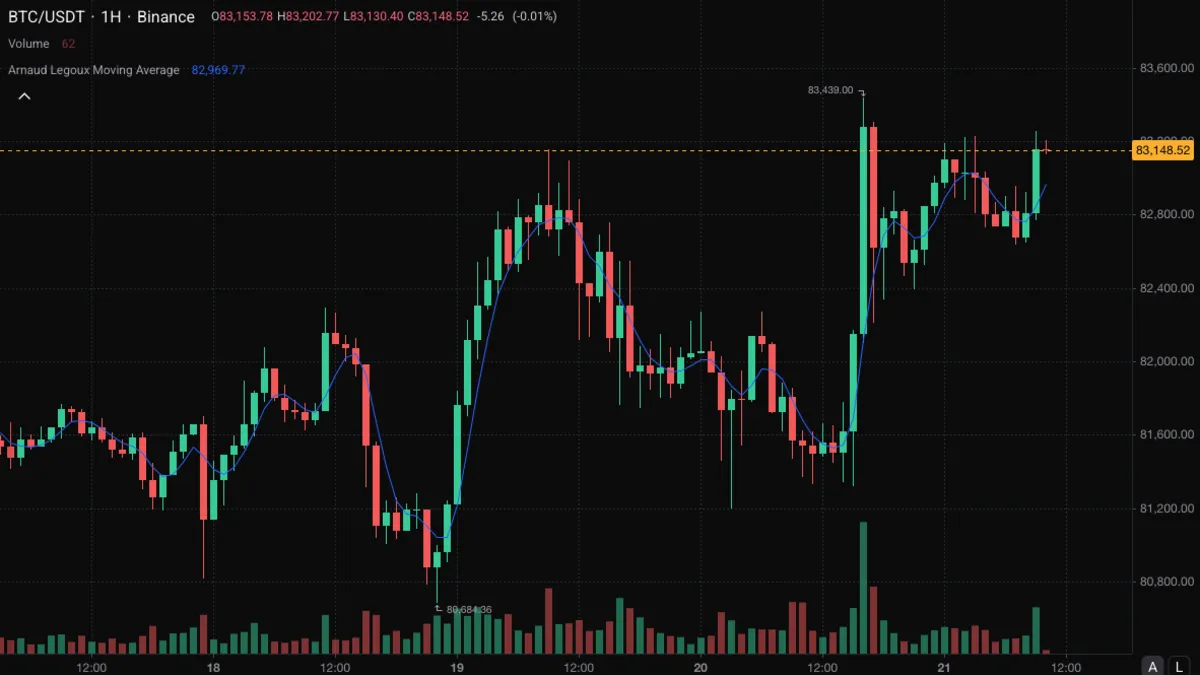
A moving average whose weights follow a bell curve that can be shifted towards the newest bars, so smoothness and responsiveness can be traded against each other.
View indicator
Indicator
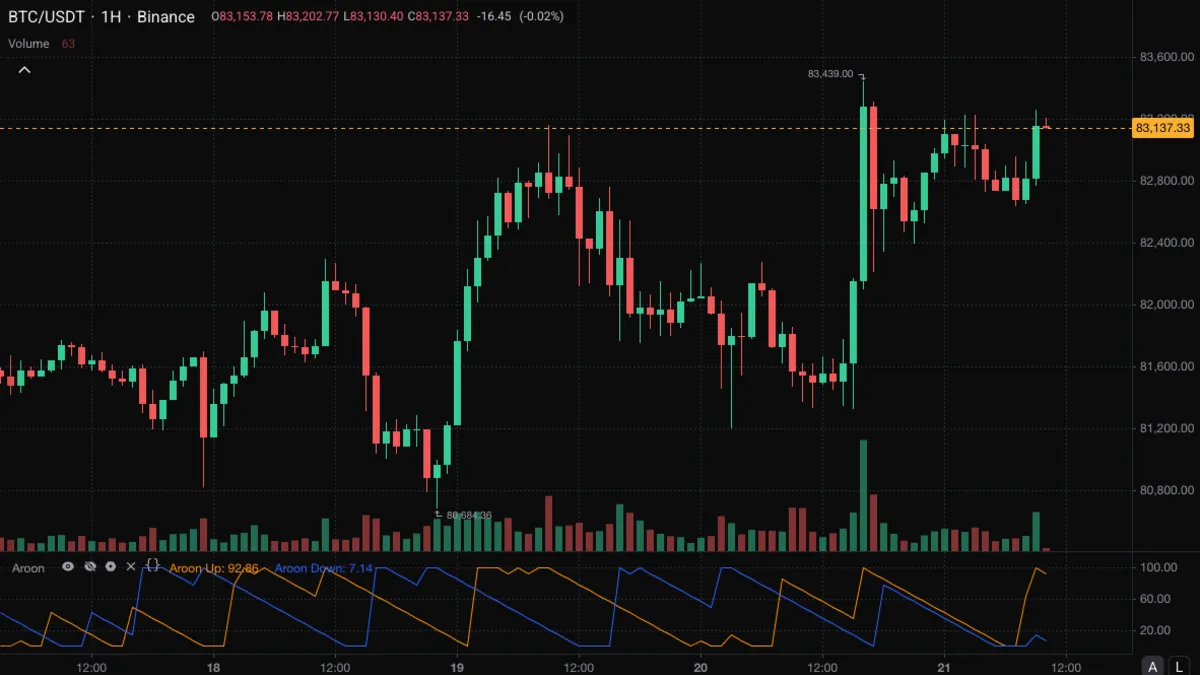
Two lines that show how recently the window made its highest high and its lowest low, so you can see whether new highs or new lows are the fresher event.
View indicator
Indicator
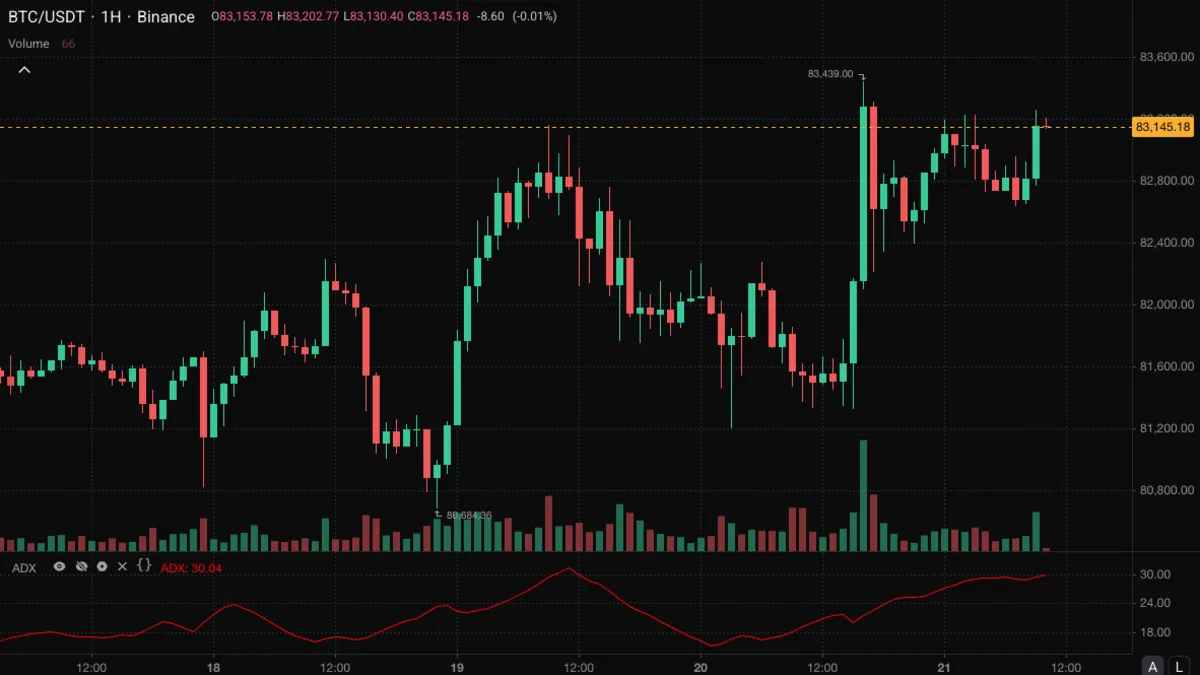
A single 0 to 100 line that measures how strongly price is trending, whichever way it is going.
View indicator
Indicator
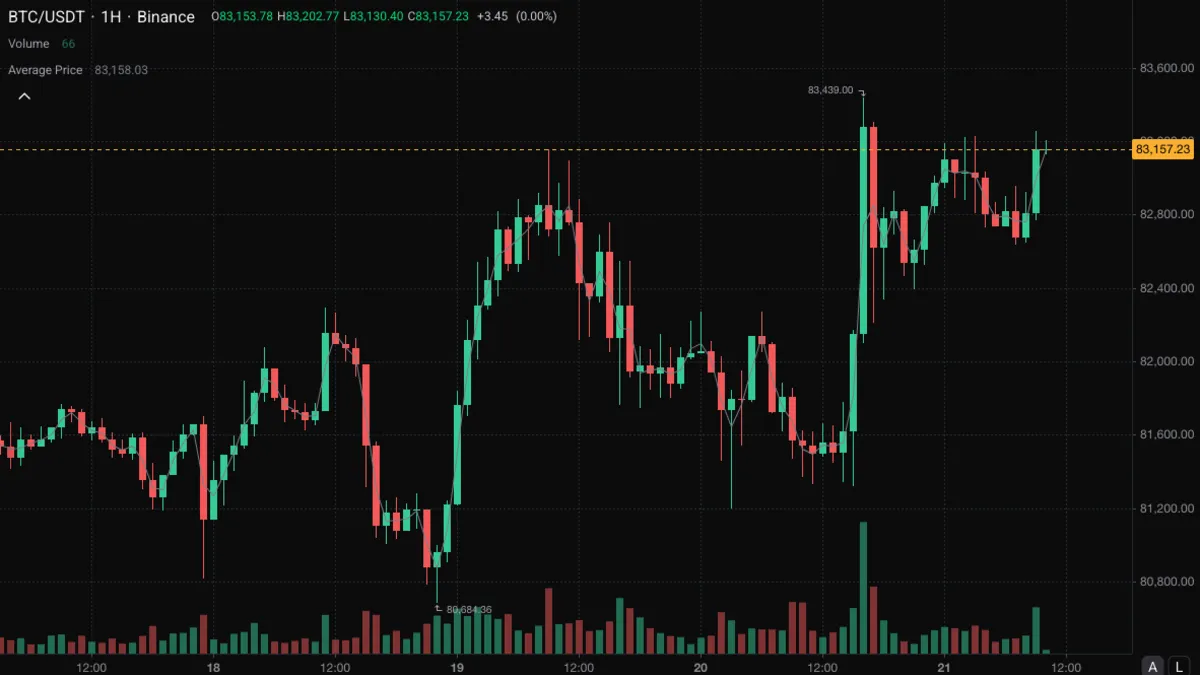
Each bar reduced to one number, the average of its open, high, low and close, drawn as a line over the candles.
View indicator
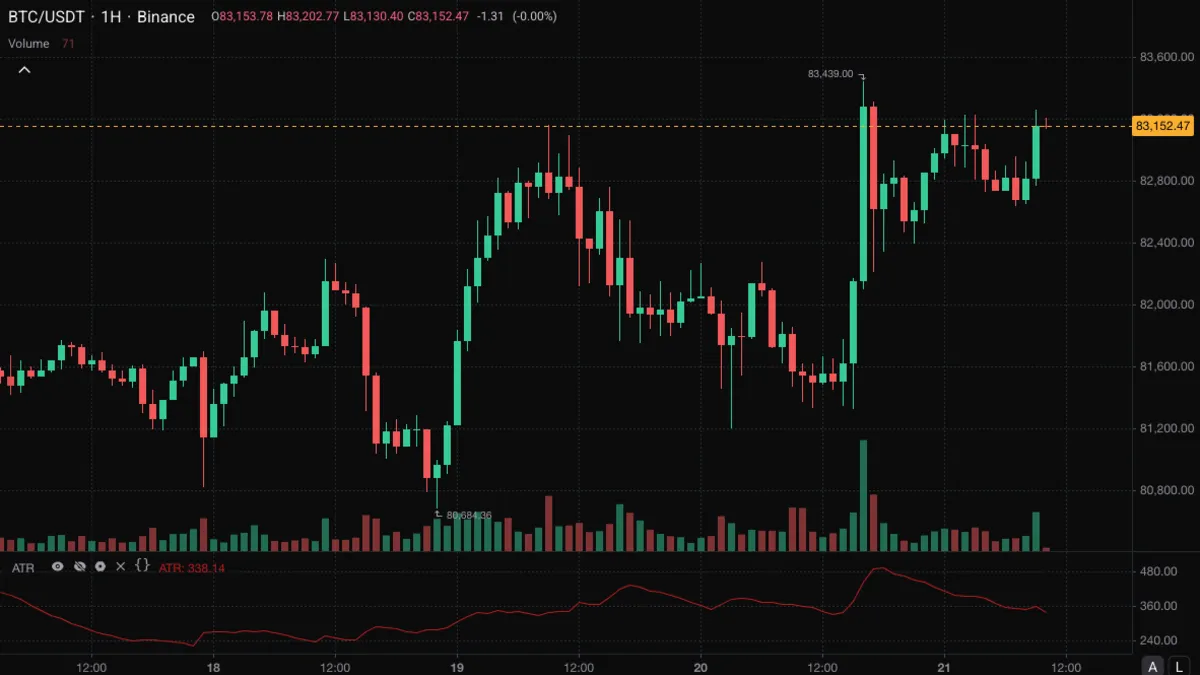
Indicator
How far price typically travels in one bar, including gaps, which is the usual yardstick for sizing stops and judging volatility.
View indicator
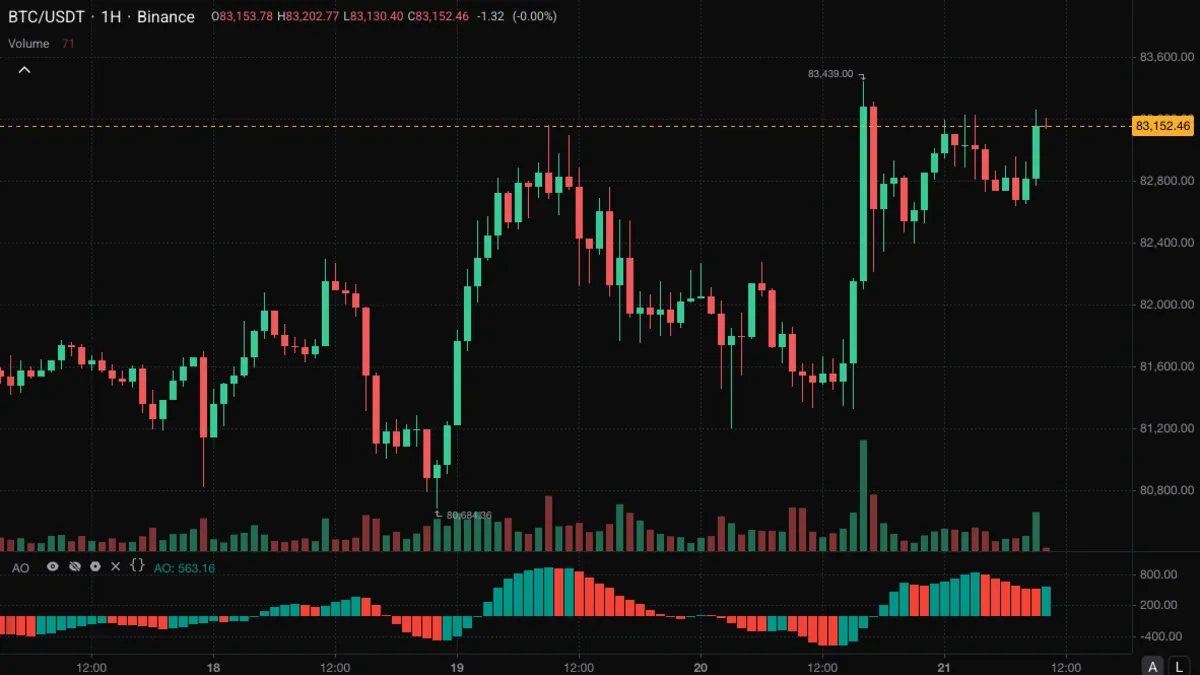
Indicator
The gap between a 5-bar and a 34-bar average of each bar's midpoint, drawn as columns coloured by whether momentum is building or fading.
View indicator
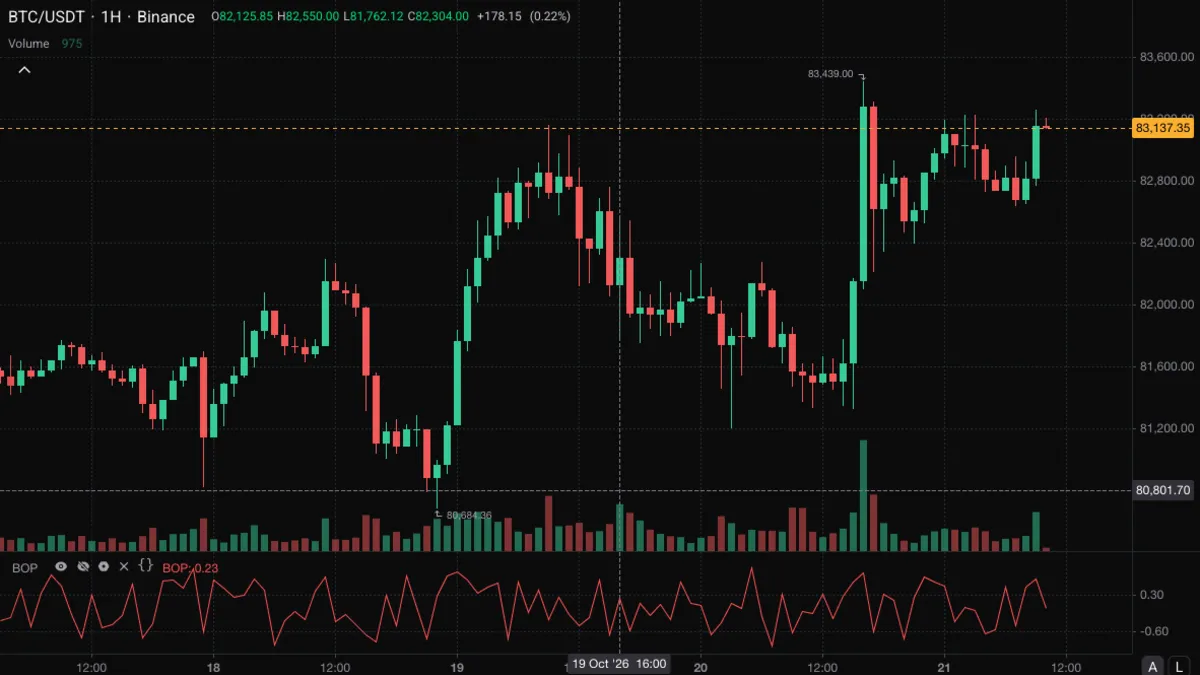
Indicator
Where each bar closed relative to where it opened, measured against the bar's full range, from +1 for buyers in full control to -1 for sellers.
View indicator
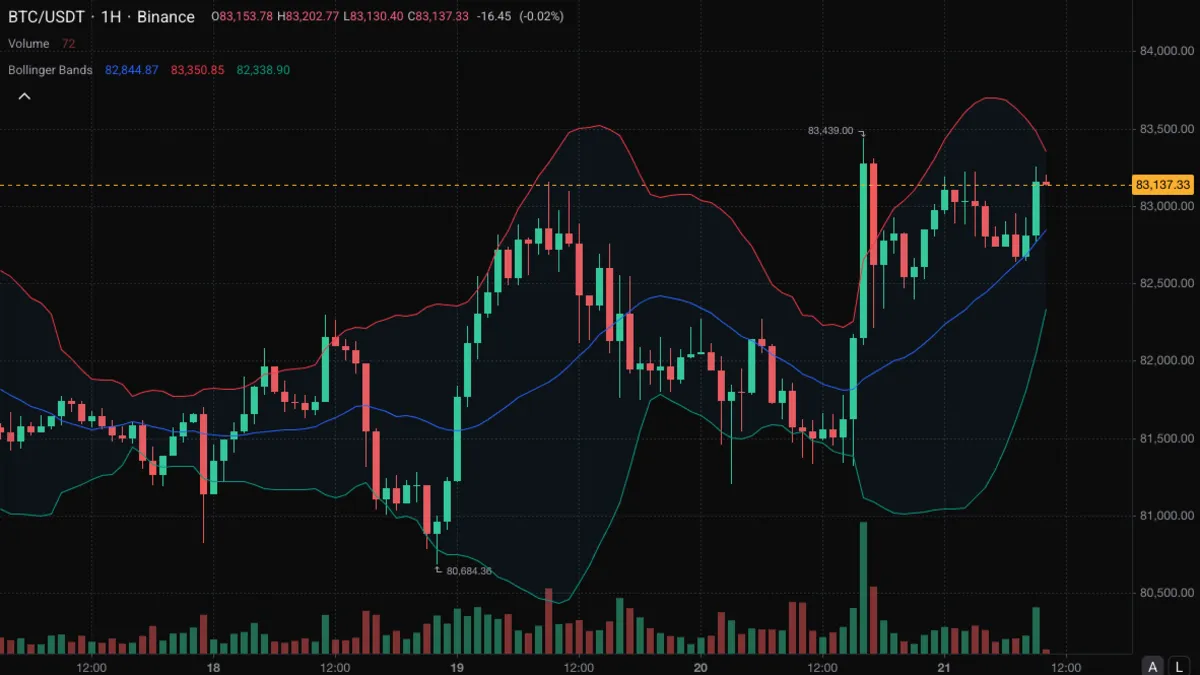
Indicator
A moving average with a band either side set by recent volatility, which shows how far price has stretched from its own recent mean.
View indicator
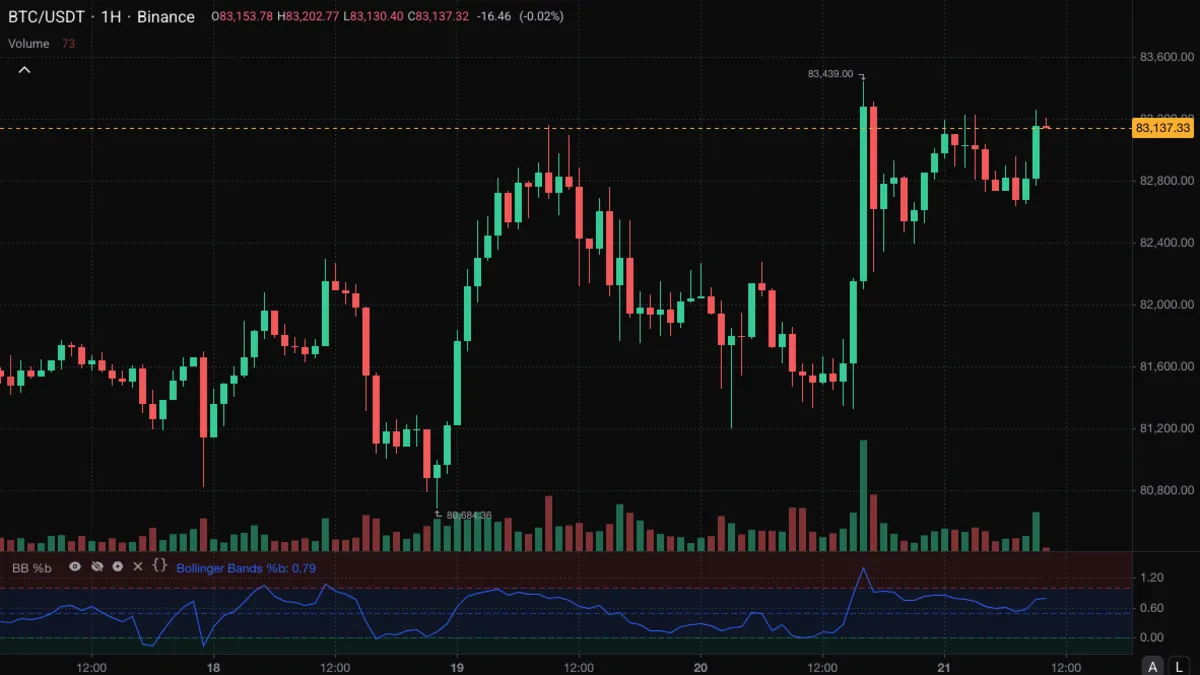
Indicator
Shows where price sits inside its own Bollinger Bands, so you can see at a glance when it is pressing on or breaking through a band.
View indicator
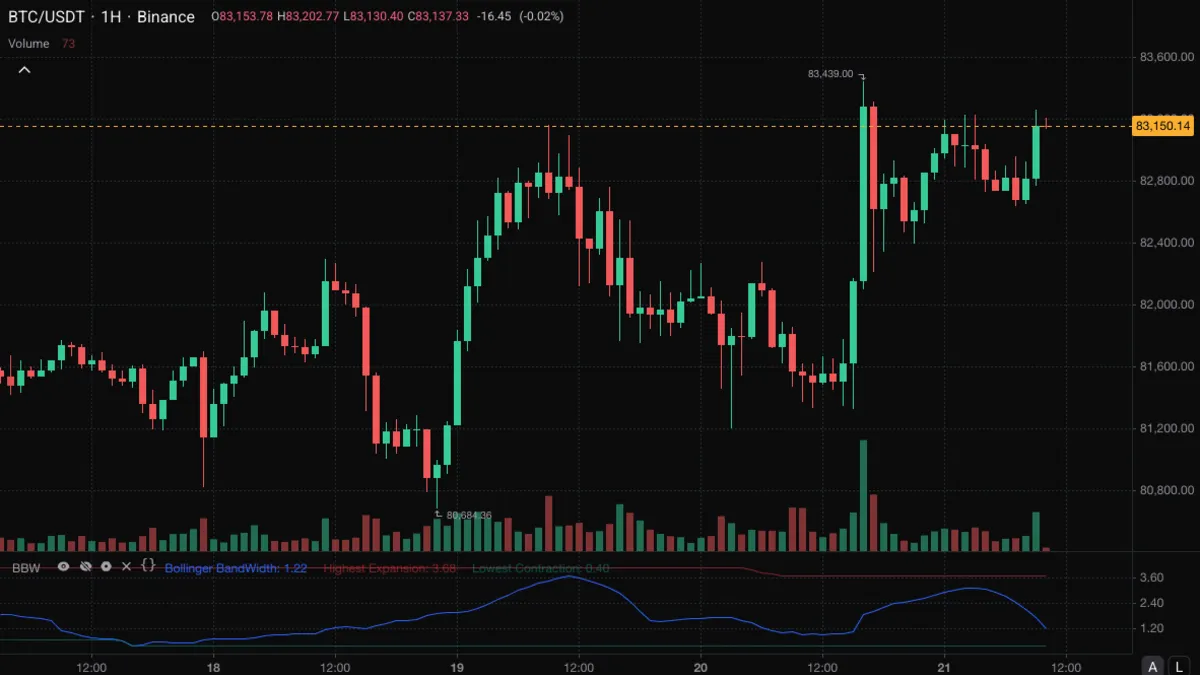
Indicator
The width of the Bollinger Bands as a percentage of their middle line, with its own recent high and low drawn alongside so a squeeze is easy to spot.
View indicator
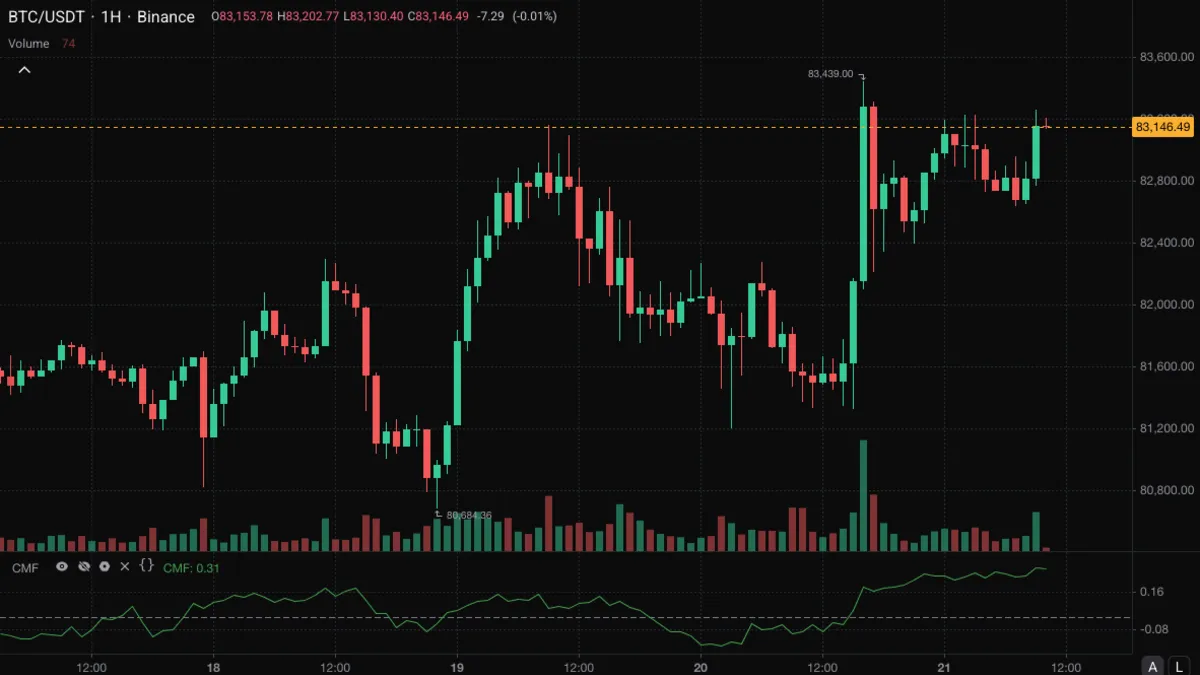
Indicator
Volume signed by where each bar closed in its range, summed over 20 bars, so it reads above zero when buying pressure dominates and below zero when selling does.
View indicator
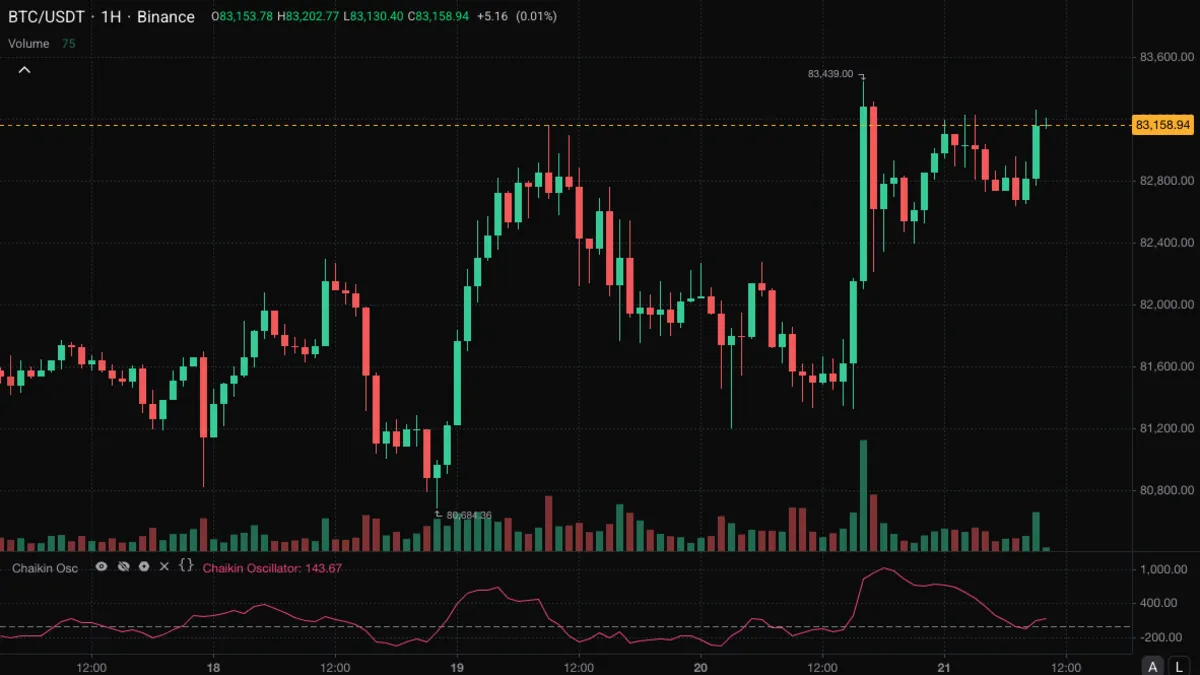
Indicator
The gap between a fast and a slow average of the Accumulation/Distribution line, showing whether buying or selling pressure is building.
View indicator
Indicator
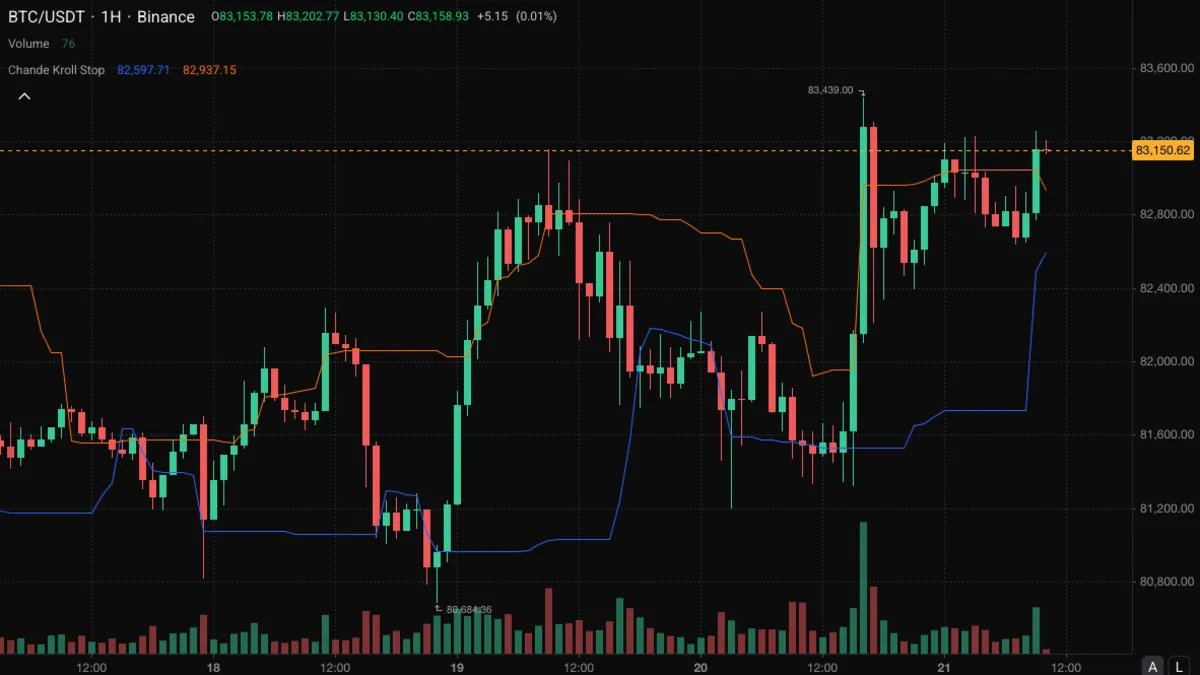
Two volatility-based stop lines, one for a long position and one for a short, each set an ATR away from a recent extreme and then held at the furthest value of a second window.
View indicator
Indicator
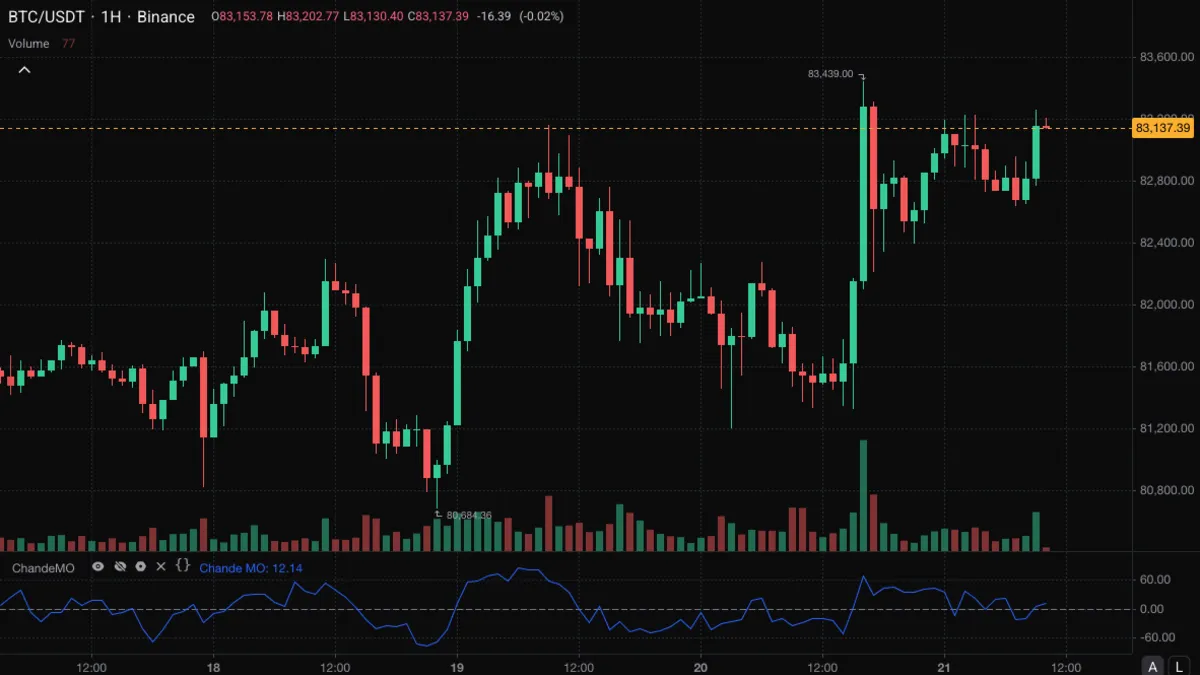
Compares the sum of recent up moves with the sum of recent down moves on a scale from -100 to +100.
View indicator
Indicator
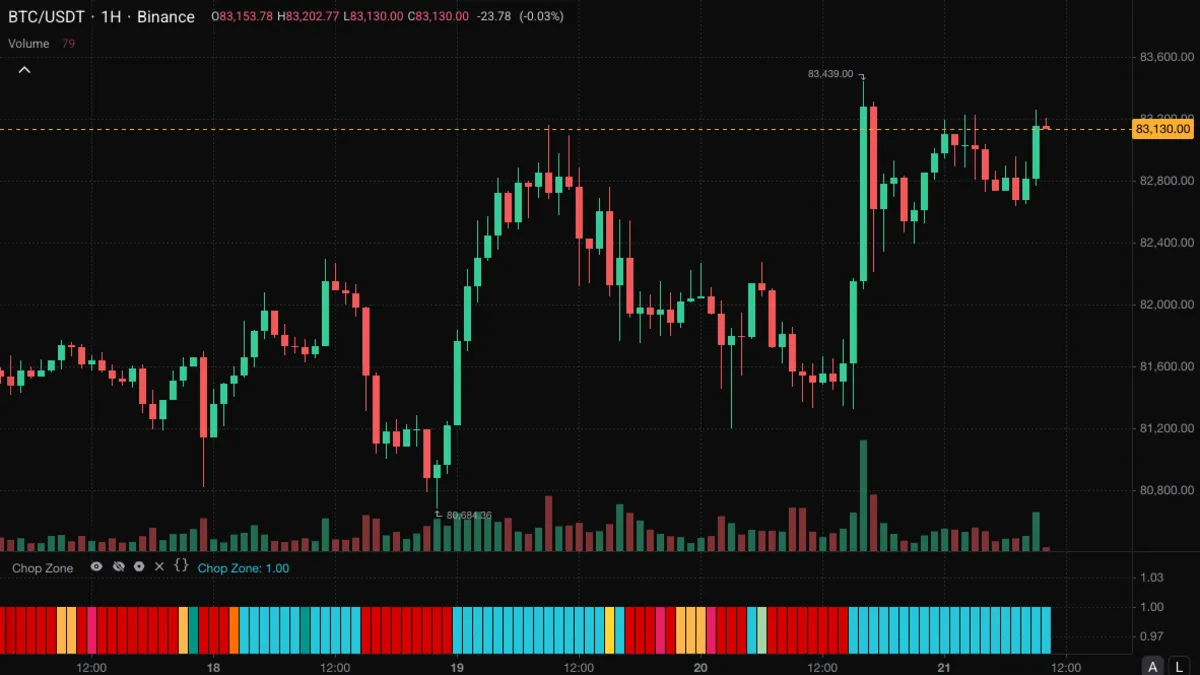
Colour-coded columns that show the angle of a 34-bar EMA, greens while it climbs, reds while it falls and yellow when it is flat and price is chopping sideways.
View indicator
Indicator
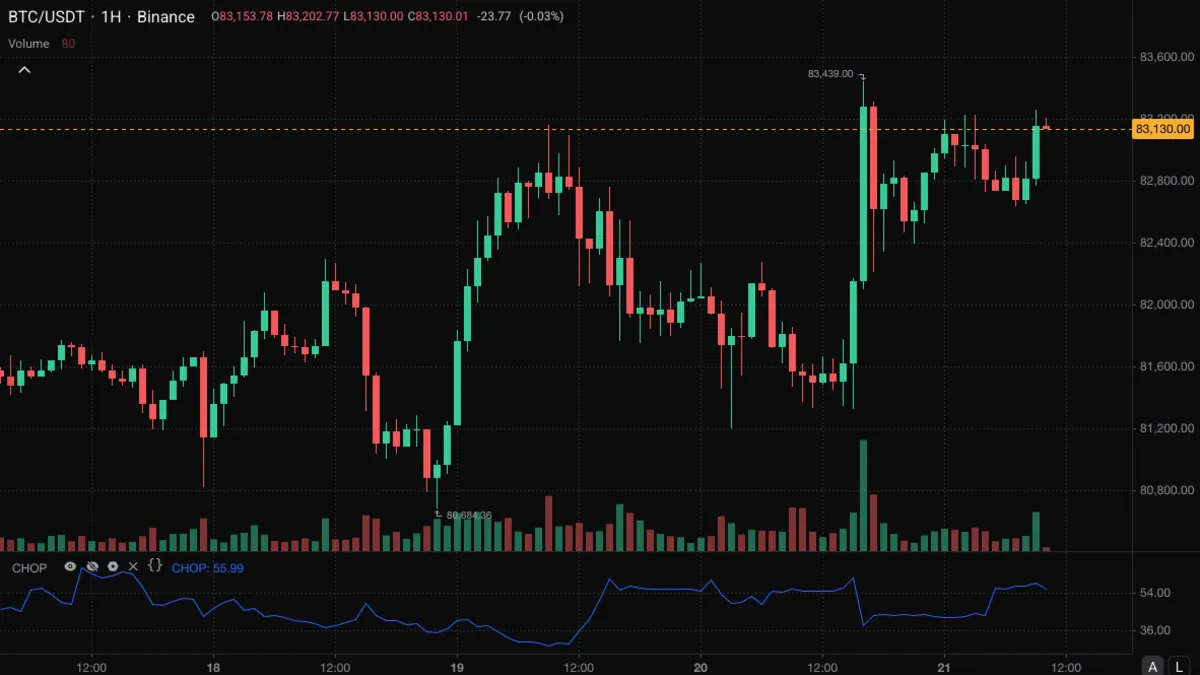
A 0 to 100 reading of how much ground price covered compared with how far it actually got, so you can tell a ranging market from a trending one.
View indicator
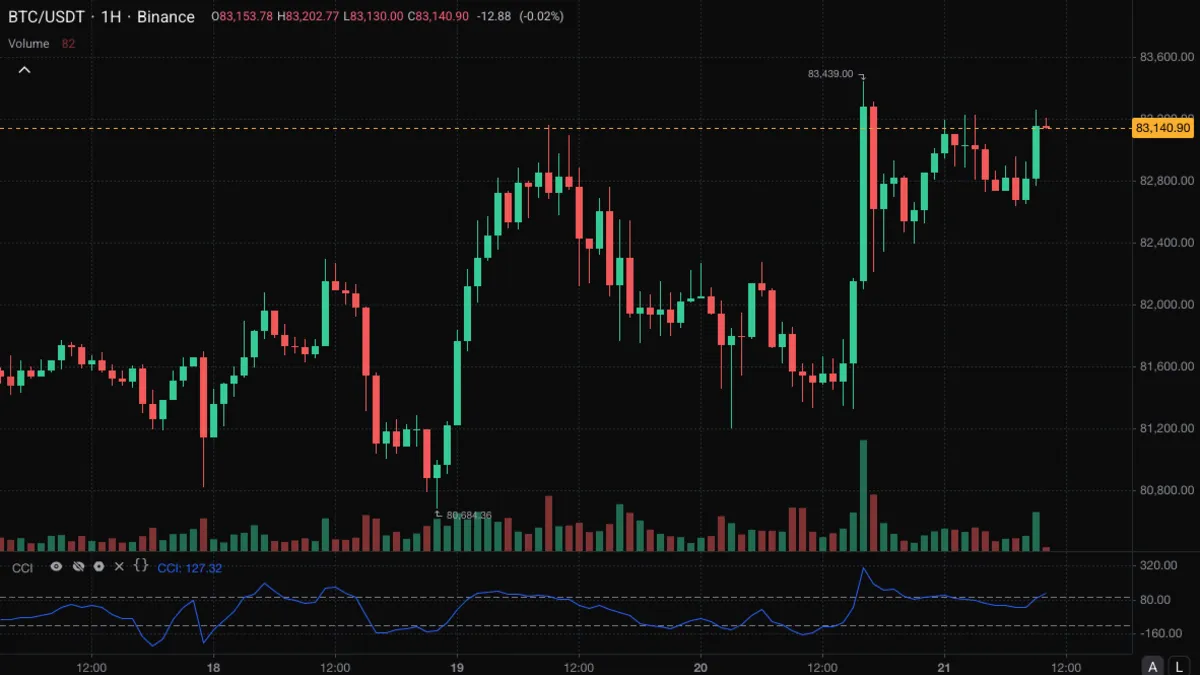
Indicator
Measures how far typical price sits from its own average in units of average deviation, so unusually stretched moves stand out.
View indicator
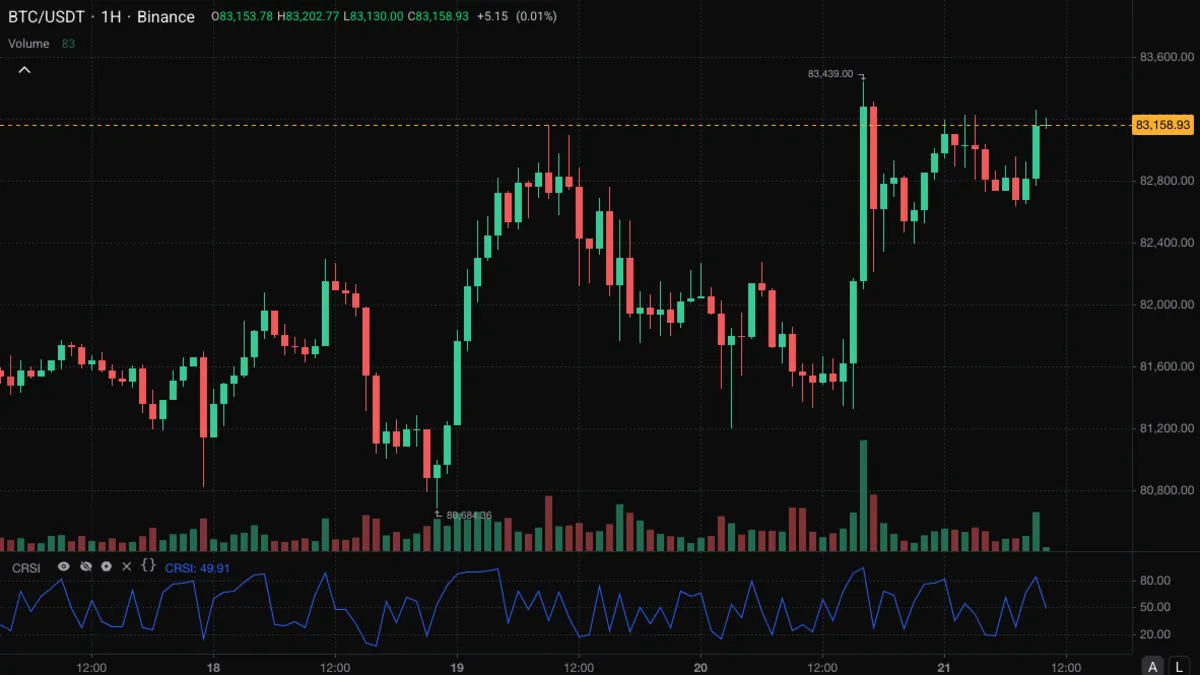
Indicator
Averages a very short RSI, an RSI of the current run of up or down closes and the rank of today's return, to show short-term stretch on a 0 to 100 scale.
View indicator
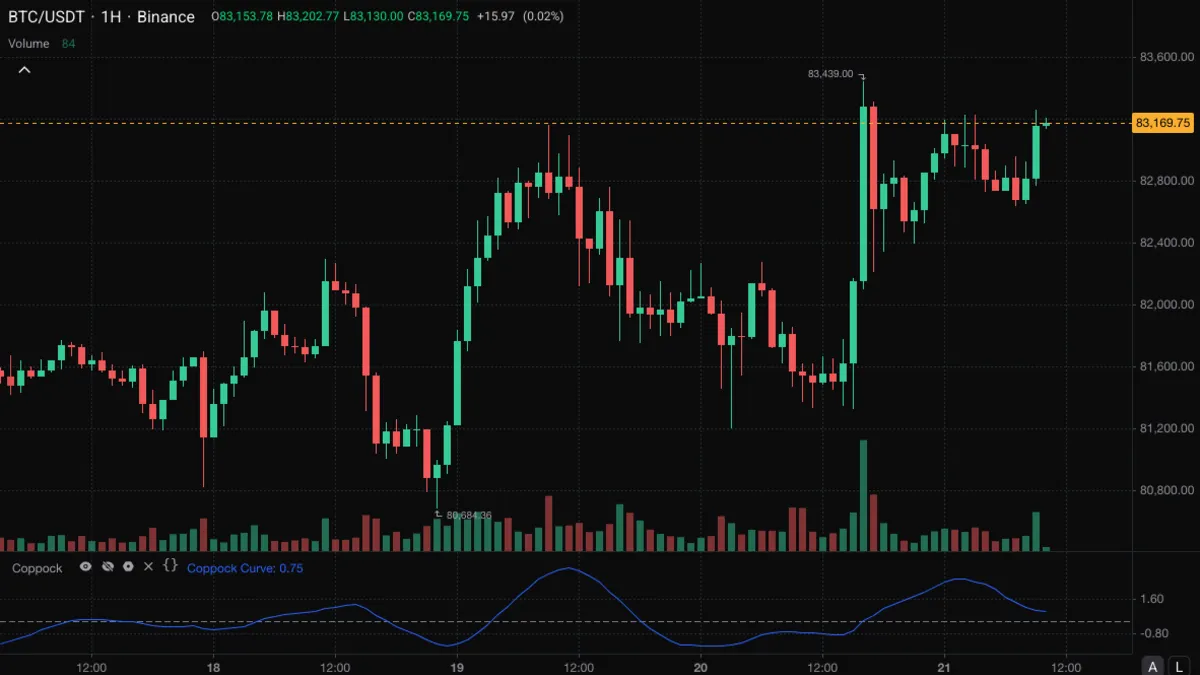
Indicator
Two rates of change added together and smoothed with a weighted average, a slow momentum line whose turns from below zero are read as the end of a decline.
View indicator
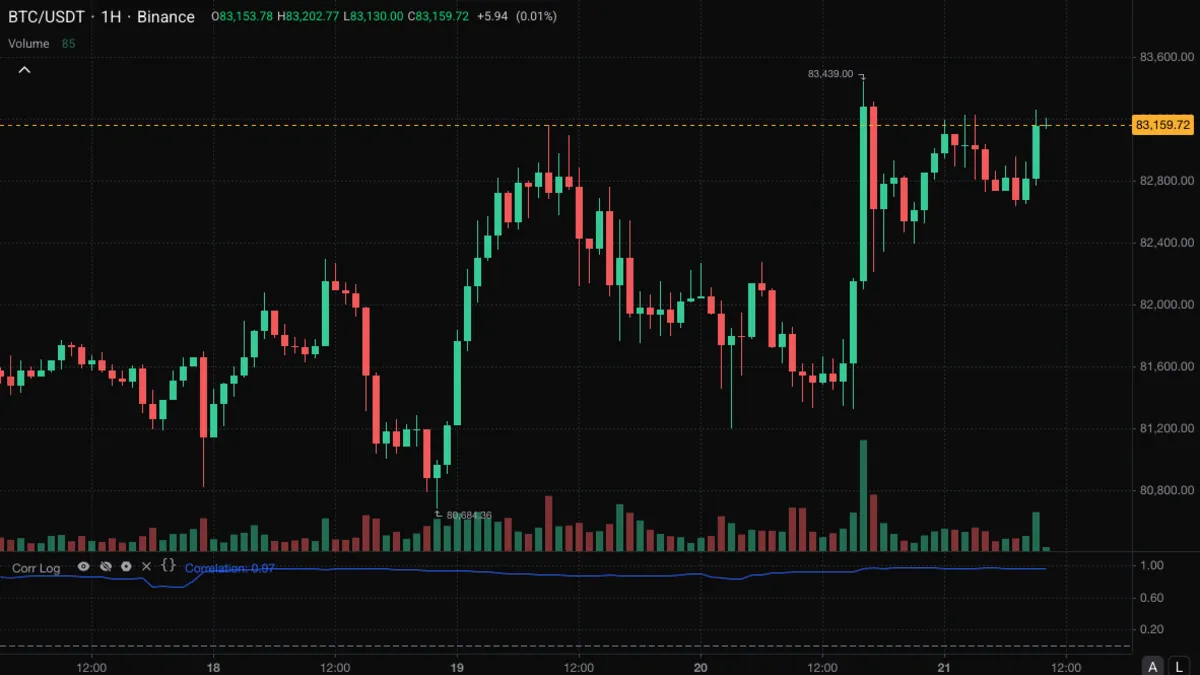
Indicator
A line from -1 to +1 showing how closely this market's bar-to-bar moves have matched another market's over recent bars.
View indicator
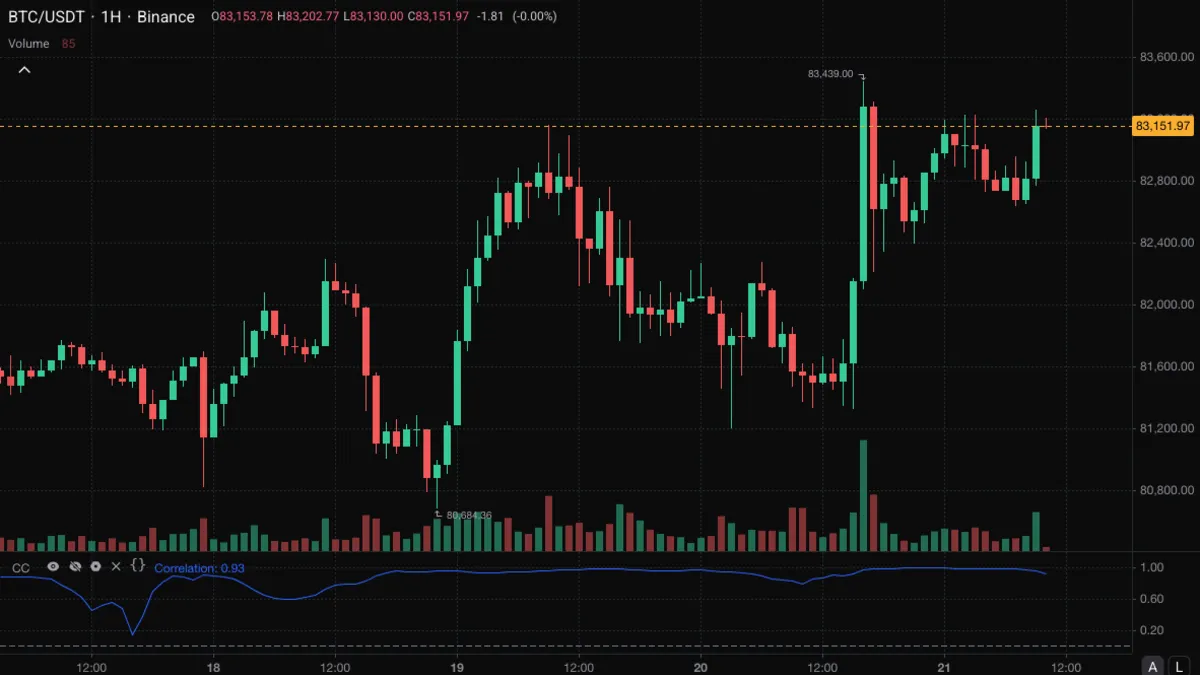
Indicator
A line from -1 to +1 showing how closely this market's price has moved with another market's price over recent bars.
View indicator
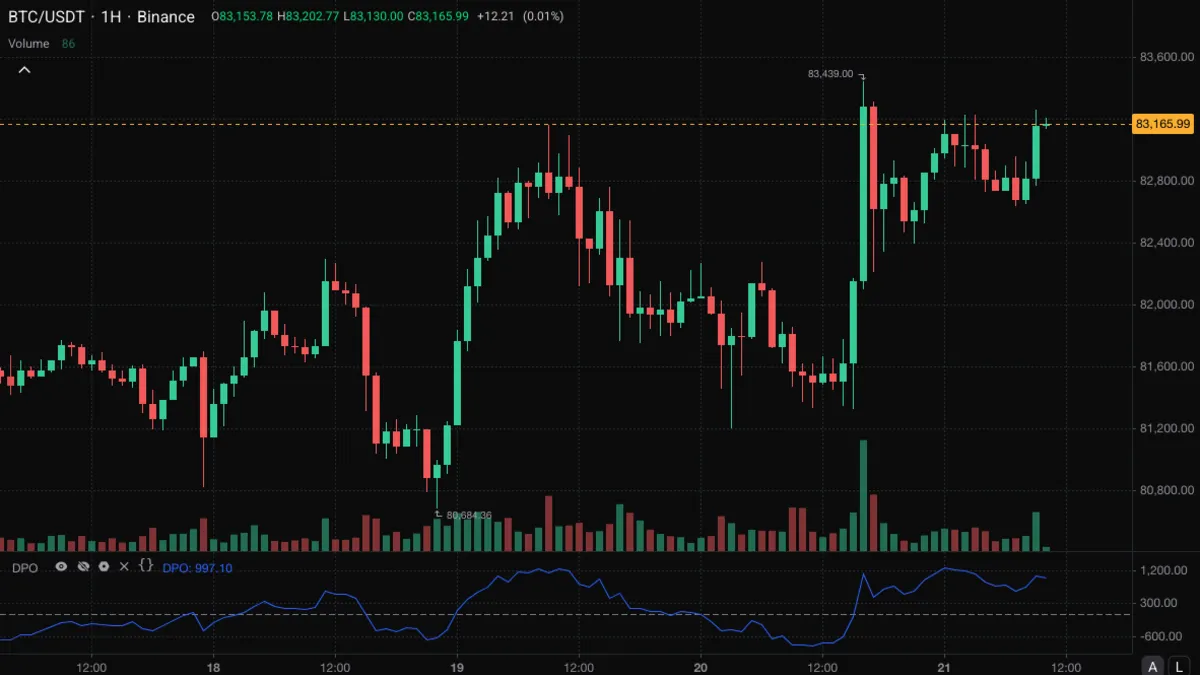
Indicator
Compares price with a moving average from several bars ago to strip out the trend and leave shorter cycles visible.
View indicator
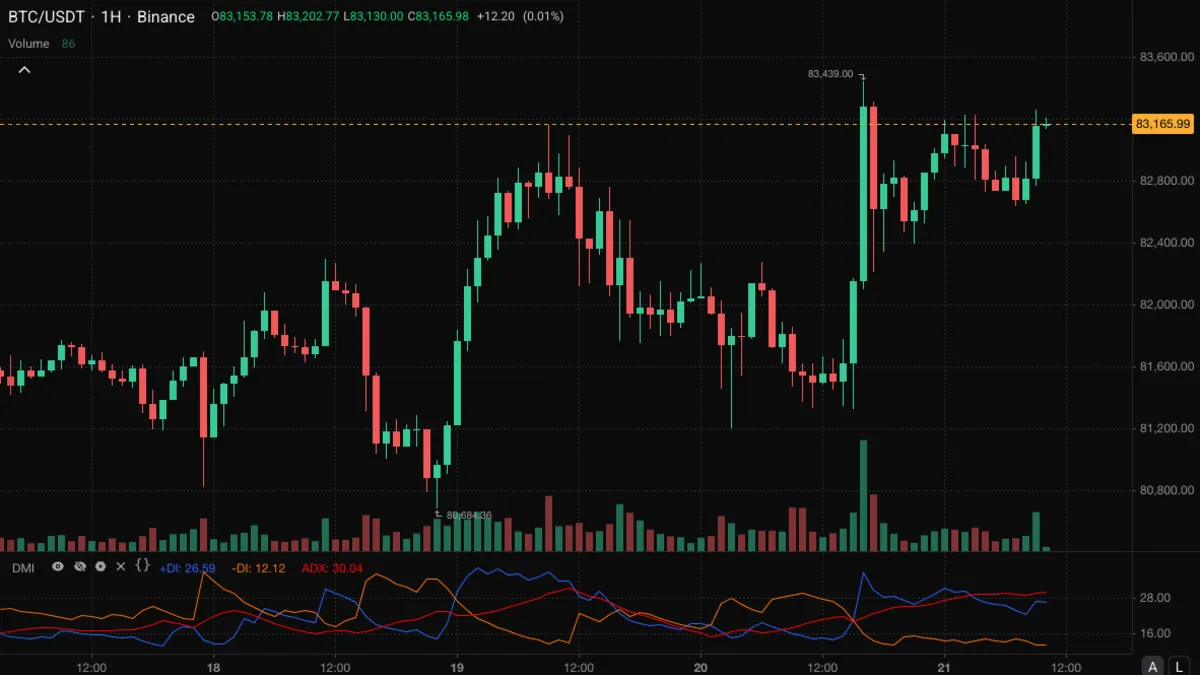
Indicator
The full directional movement system, +DI, -DI and ADX in one pane, showing which side has been moving price and how strongly.
View indicator
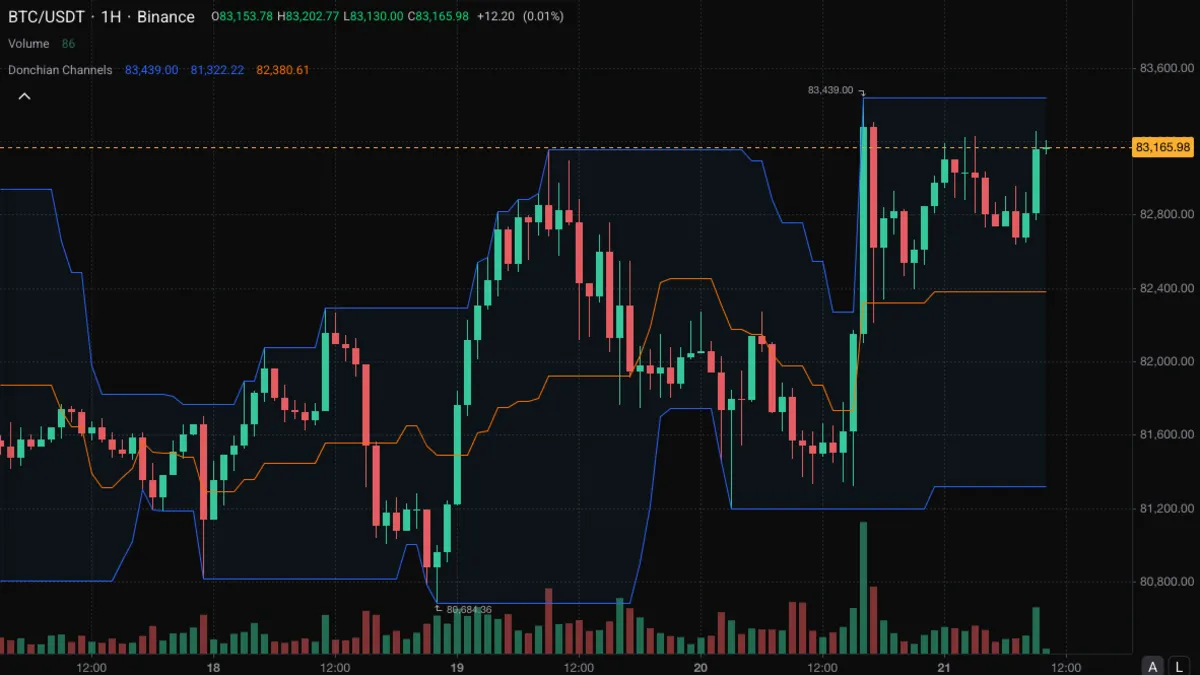
Indicator
The highest high and lowest low of the last 20 bars with their midpoint, so a new high or low for the period shows directly on the chart.
View indicator
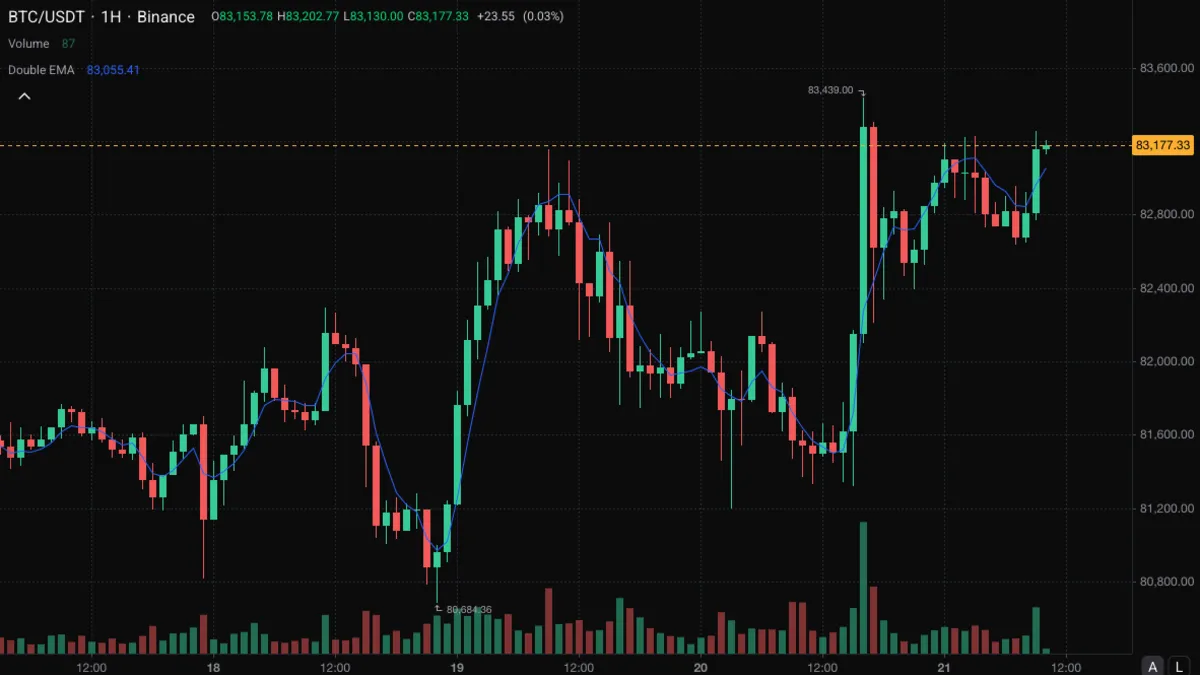
Indicator
An EMA with an estimate of its own lag added back, so it turns sooner than an EMA of the same length, at the cost of overshooting at turns.
View indicator
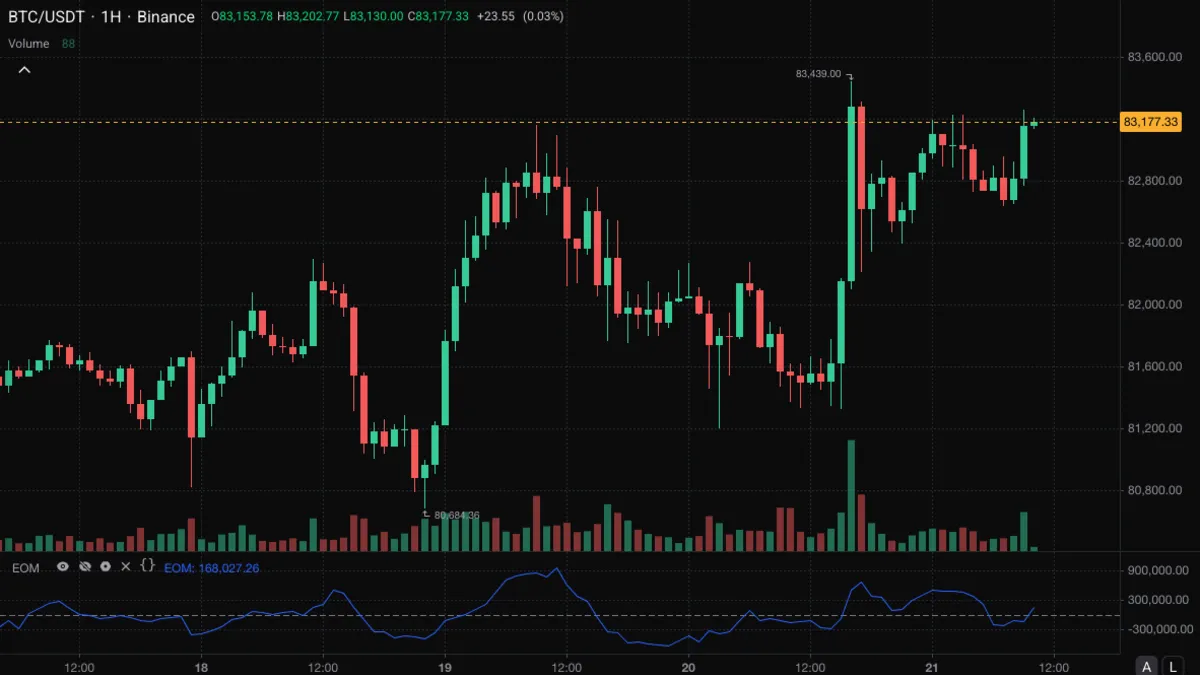
Indicator
How far the middle of each bar moved for the volume it took, smoothed, so you can see whether price is moving easily or being worked hard.
View indicator
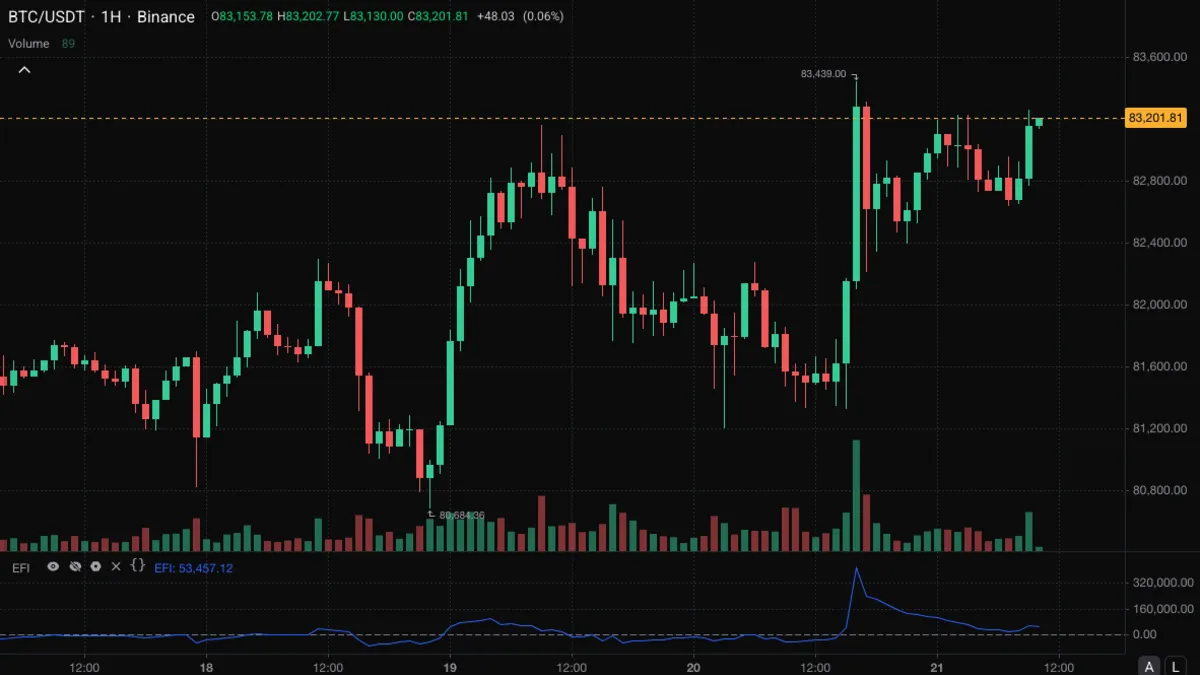
Indicator
The change in close multiplied by the volume behind it, smoothed, so you can see whether buying or selling pressure has the upper hand.
View indicator
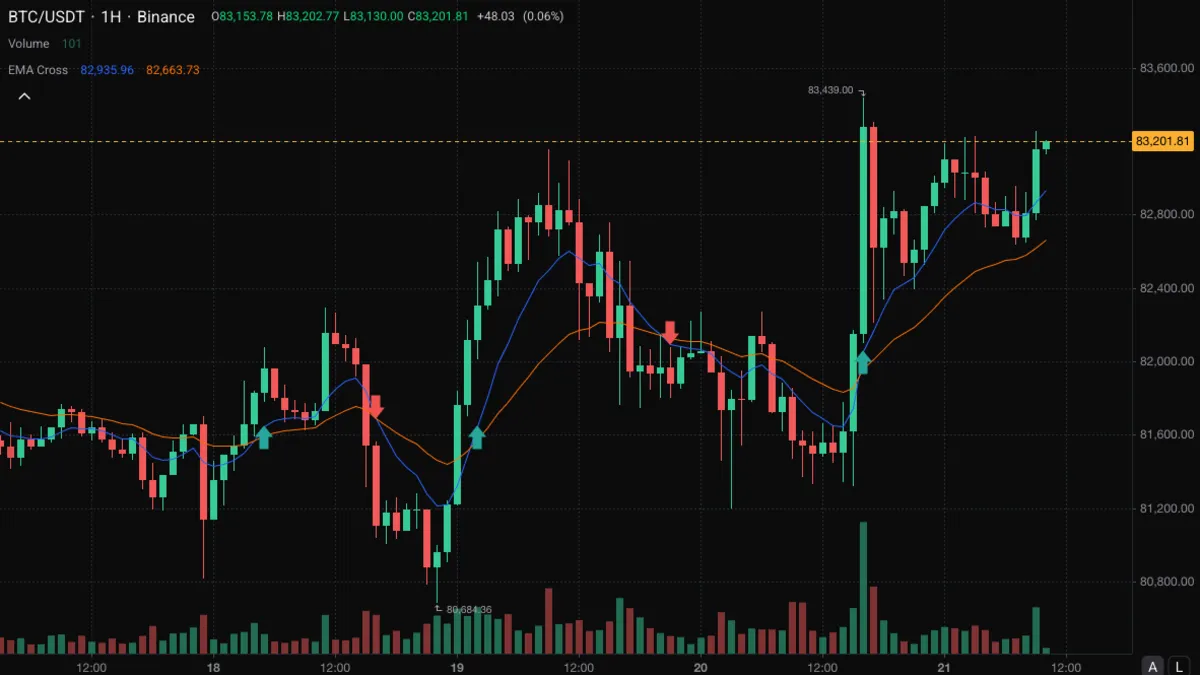
Indicator
A fast and a slow exponential moving average with every crossing marked by an arrow, crossing earlier than a simple-average pair.
View indicator
Indicator
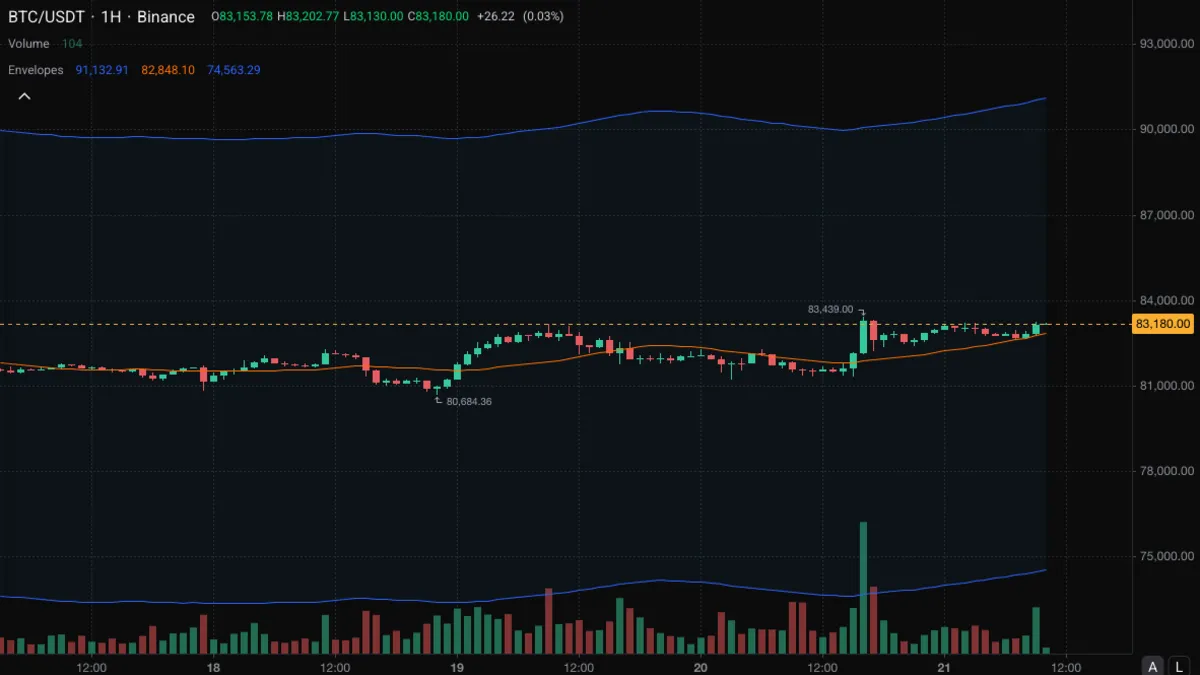
A simple moving average with a band a fixed percentage above and below it, marking how far price has stretched from its average.
View indicator
Indicator
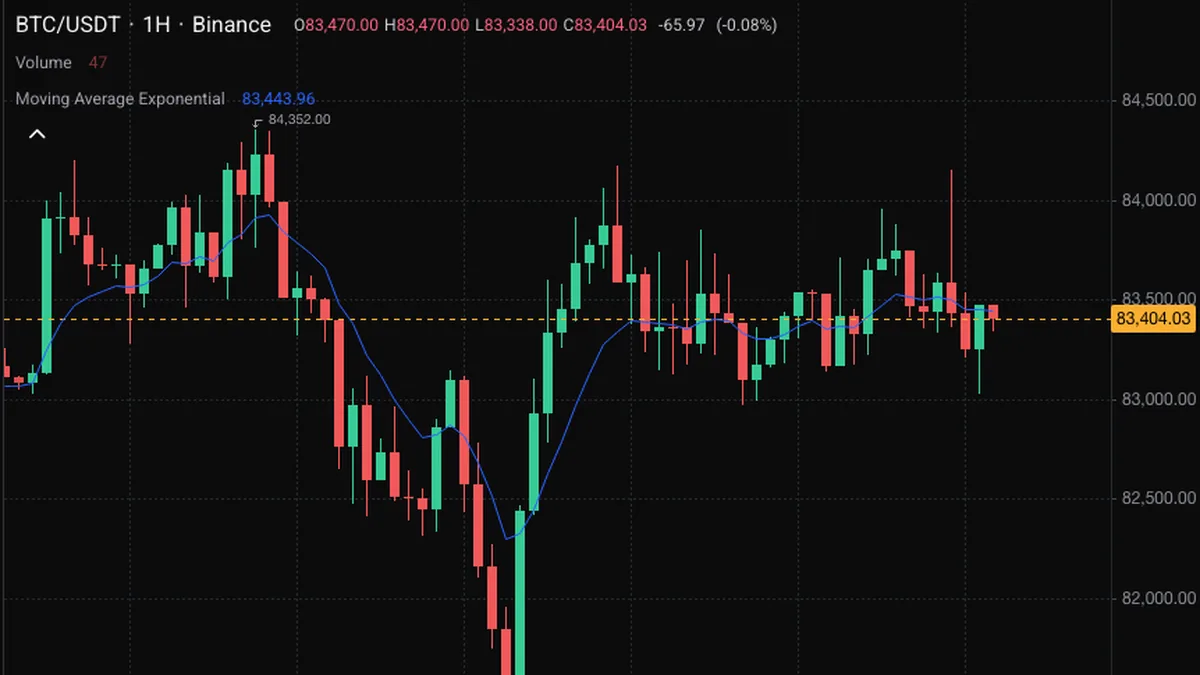
An average that weights recent bars more heavily, so it turns sooner than a simple average.
View indicator
Indicator
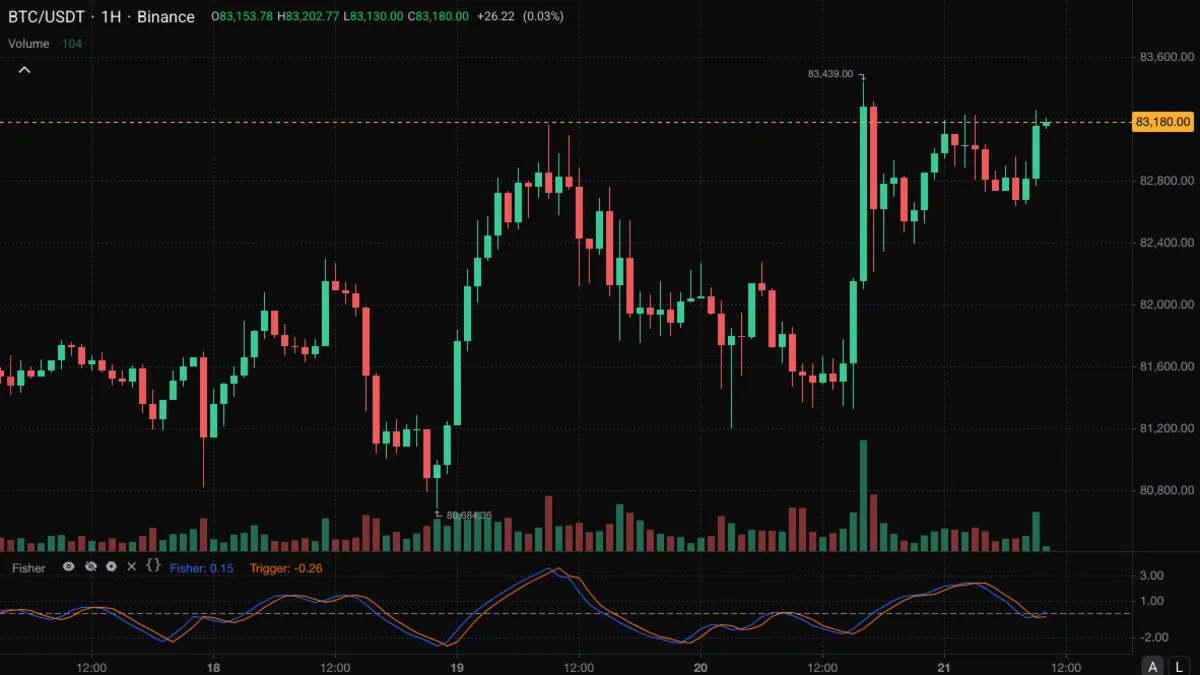
Rescales price within its recent range so that turning points show as sharp peaks and troughs, with a one-bar-lagged trigger line.
View indicator
Indicator
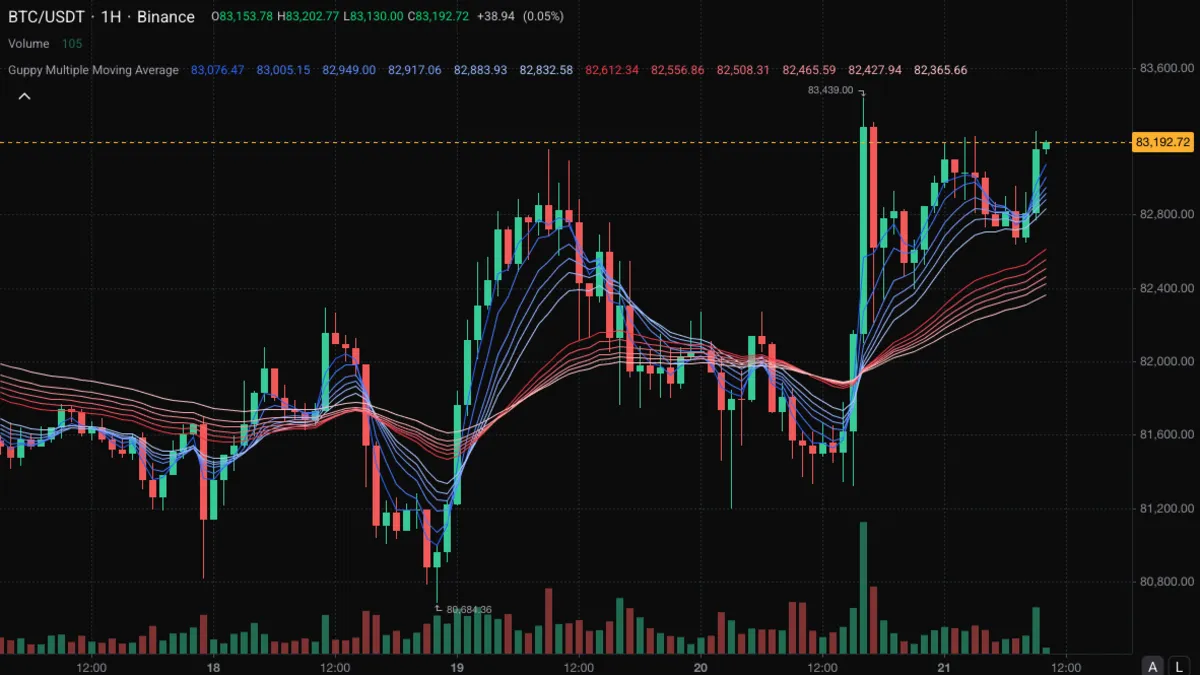
Two ribbons of exponential averages, six fast and six slow, read by how tightly each ribbon is bunched and whether the two have crossed.
View indicator
Indicator
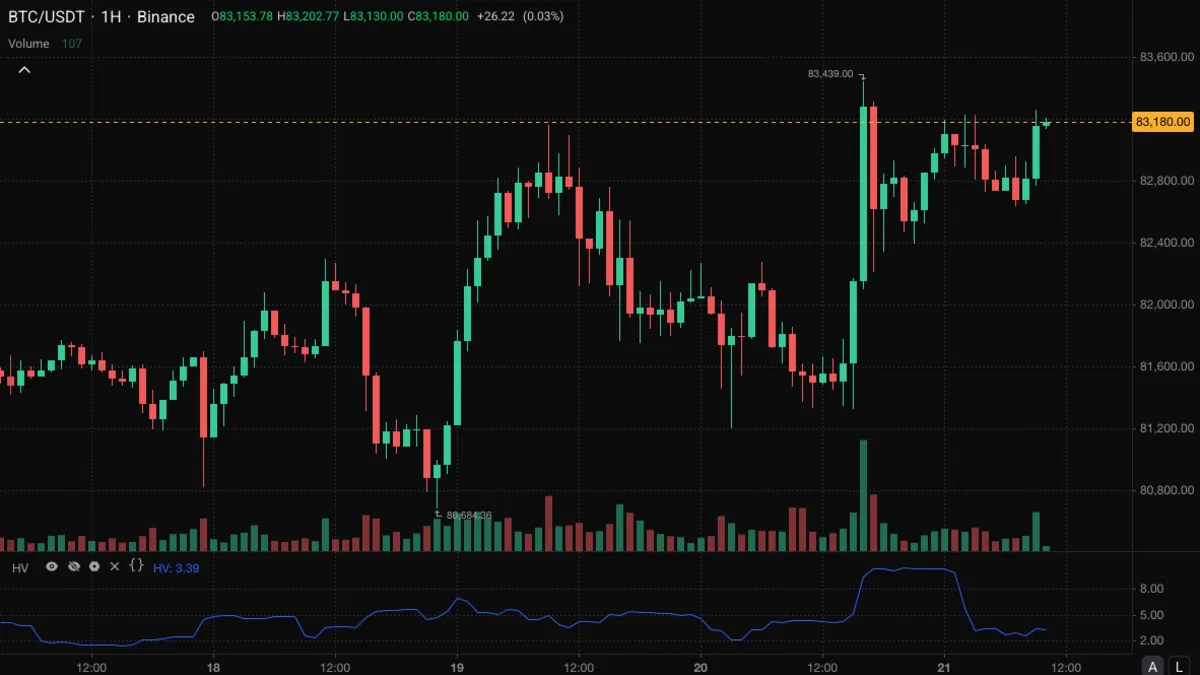
The standard deviation of recent bar-to-bar returns, scaled up to a yearly figure in percent, showing how much price has been moving regardless of direction.
View indicator
Indicator
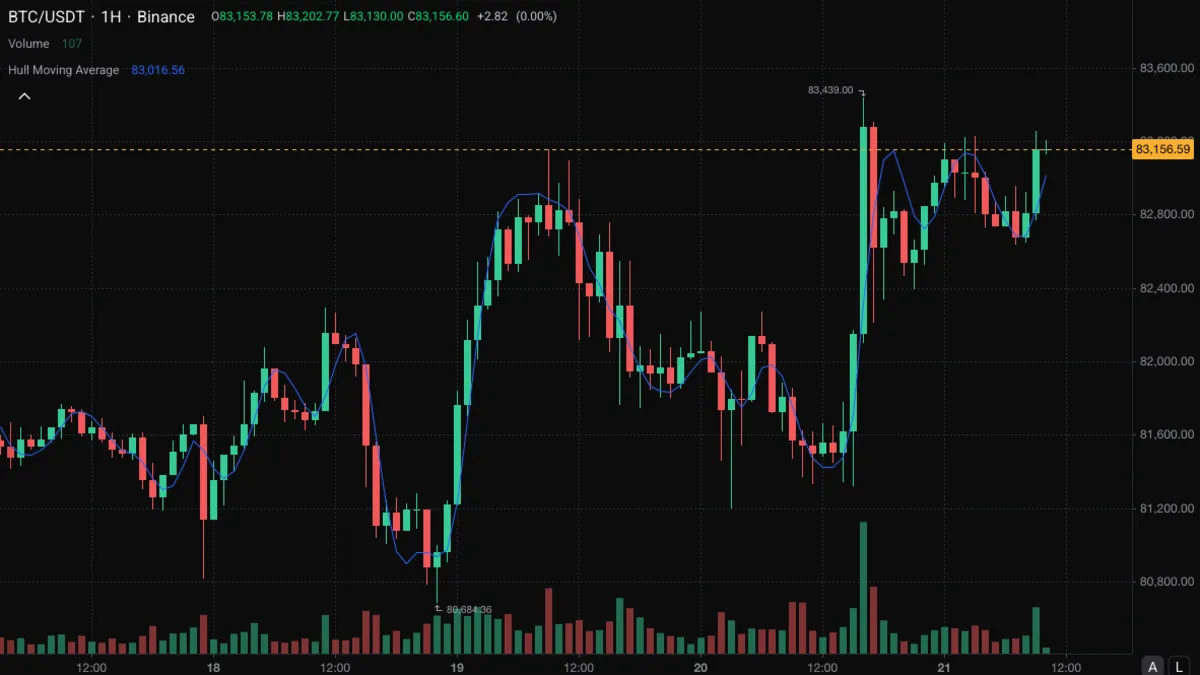
A moving average that corrects for lag and then smooths the result, so it turns faster than an EMA of the same length while staying smooth.
View indicator
Indicator
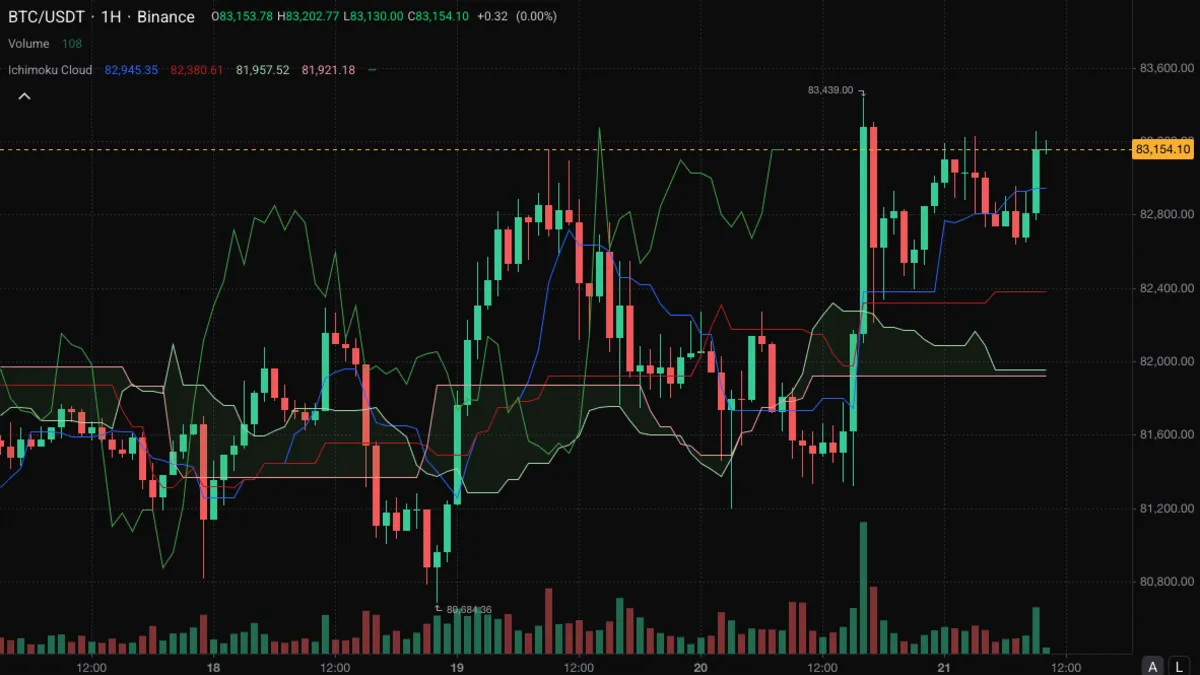
Five lines built from range midpoints, two of them shifted forward to form a cloud and one shifted back, giving a single view of trend, balance and nearby support or resistance.
View indicator
Indicator
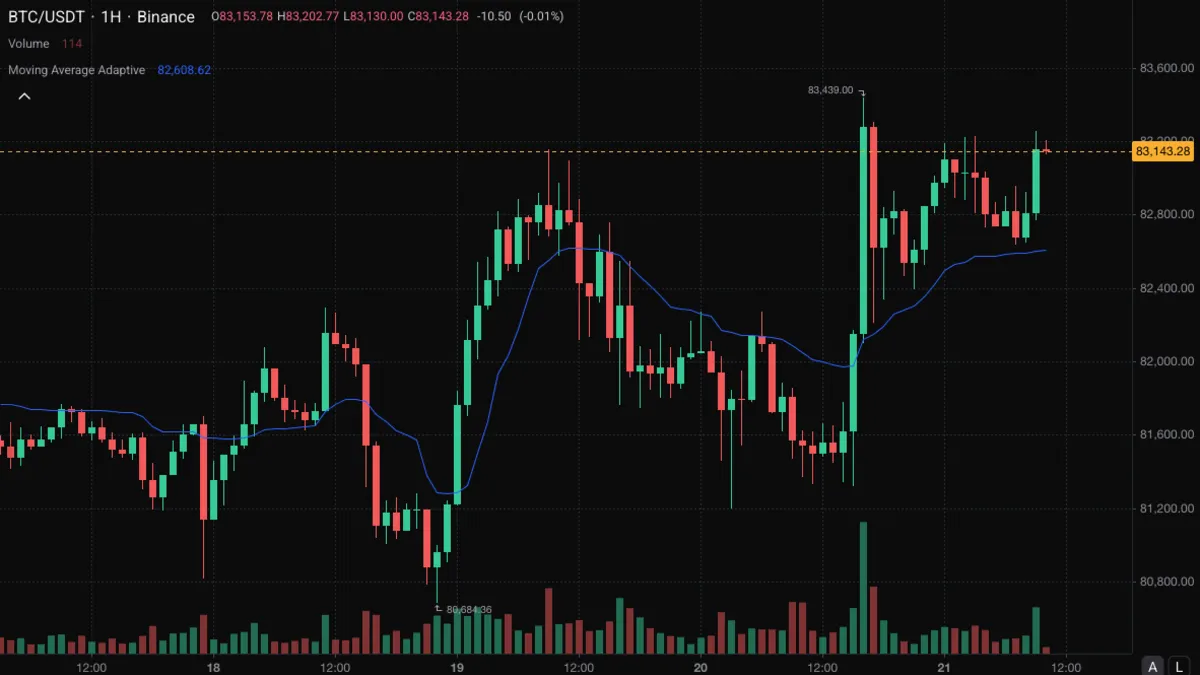
An average that speeds up when price moves cleanly in one direction and nearly stops when price chops sideways.
View indicator
Indicator
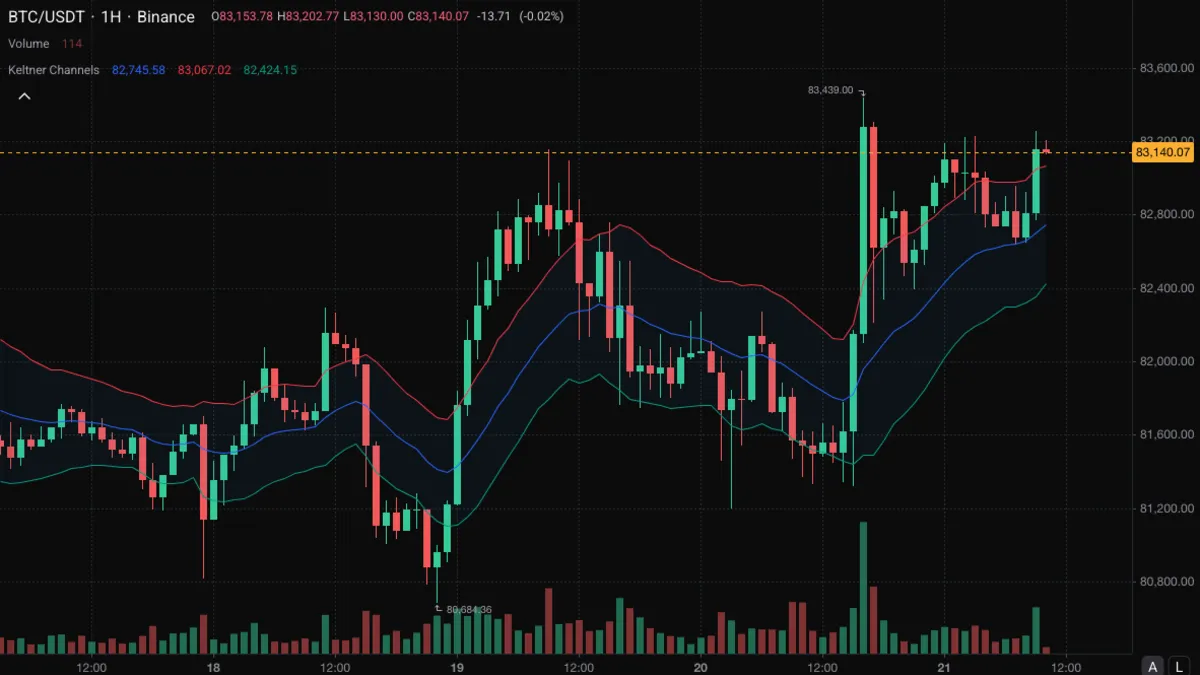
An EMA with a band either side set by the average true range of recent bars, showing whether price is stretched relative to how far it usually moves.
View indicator
Indicator
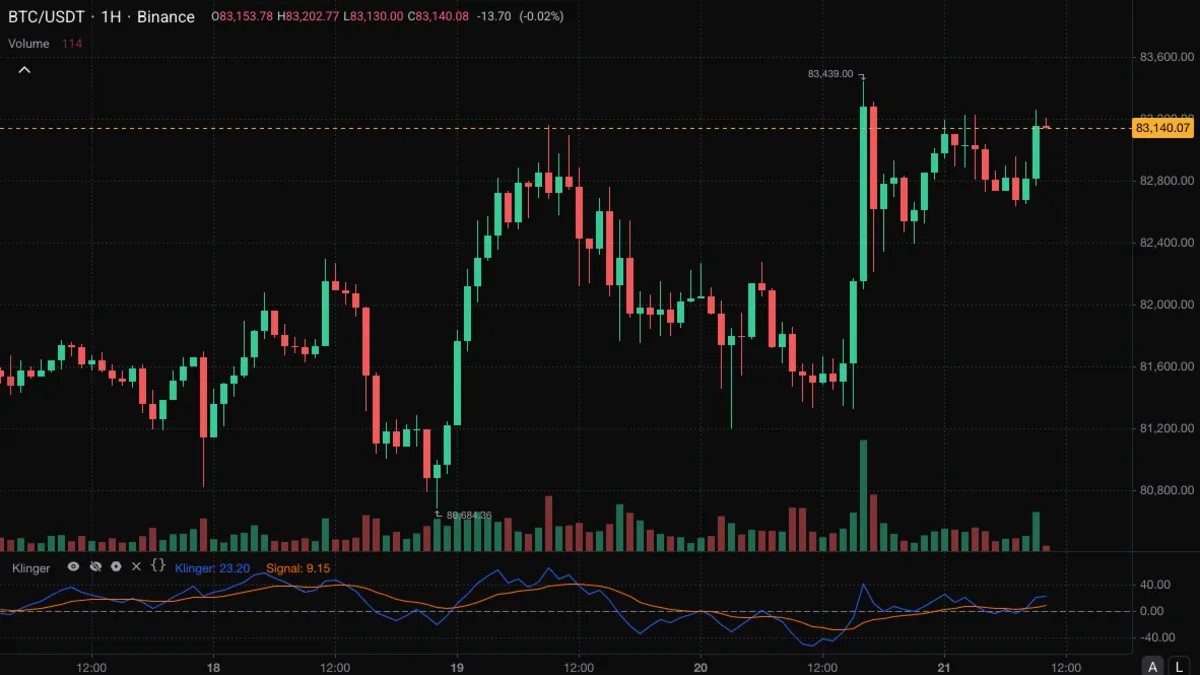
The gap between a fast and a slow average of volume signed by the direction of typical price, with a signal line, so shifts in volume pressure show up around a zero line.
View indicator
Indicator
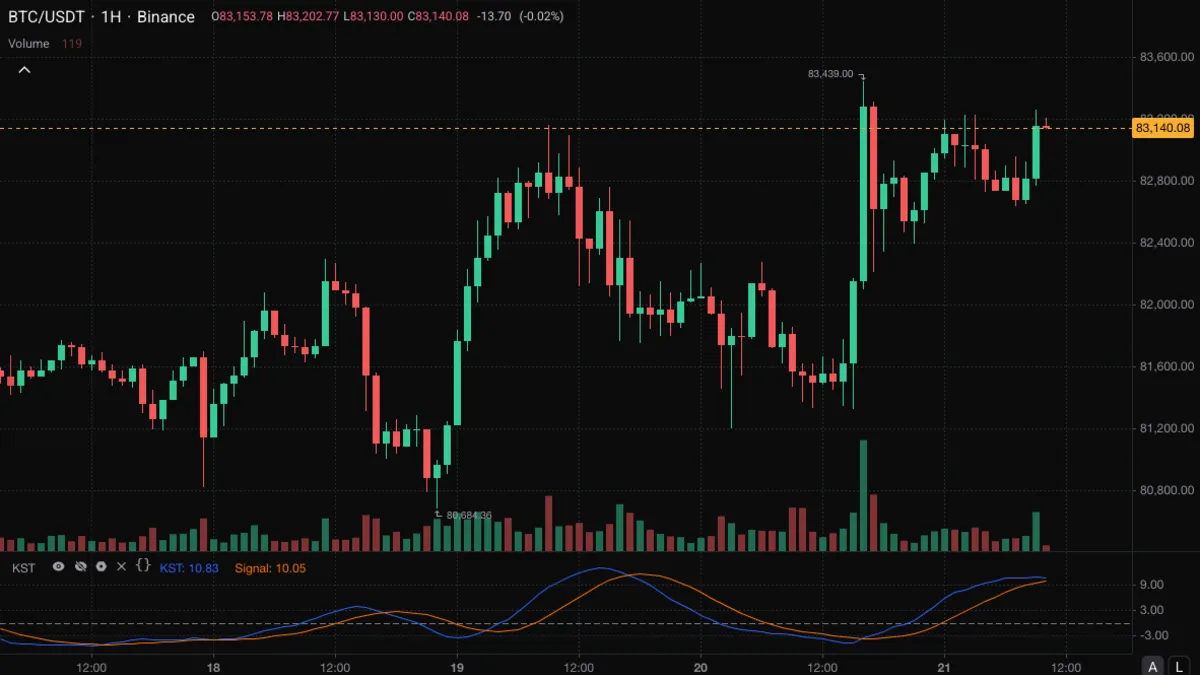
Four smoothed rates of change over lengthening horizons, weighted towards the slowest, giving a momentum line that turns late but rarely turns twice.
View indicator
Indicator
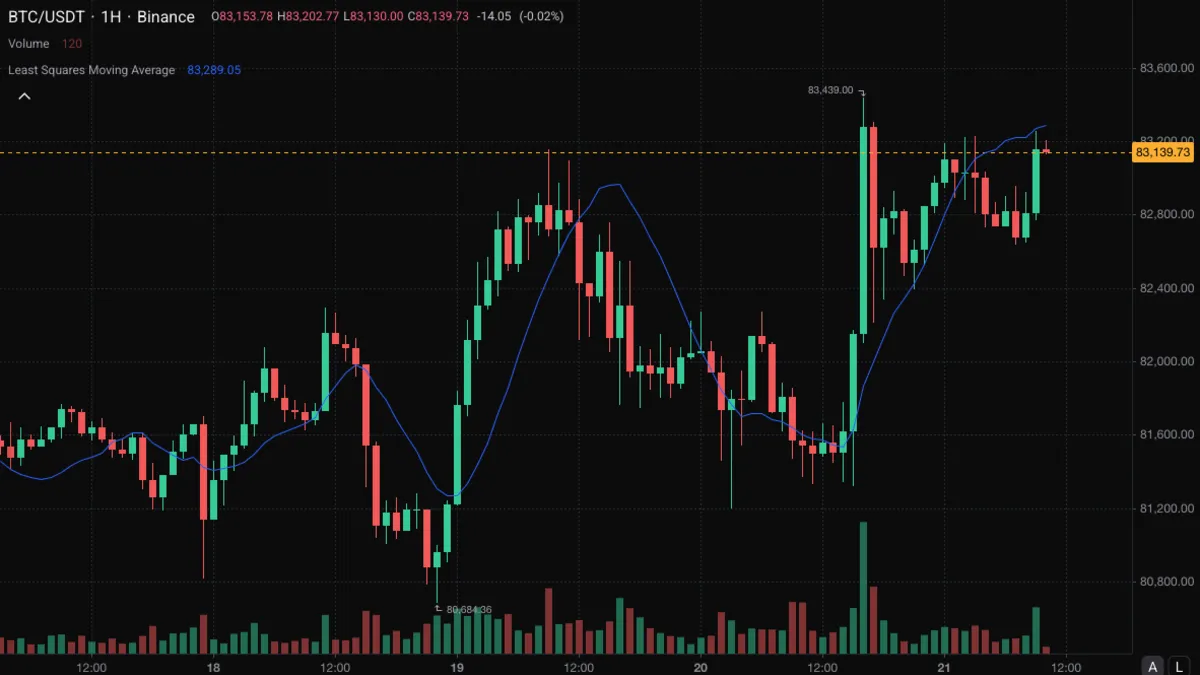
The end point of a straight line fitted through the last 25 bars, showing where the recent trend puts price now rather than where it has been on average.
View indicator
Indicator
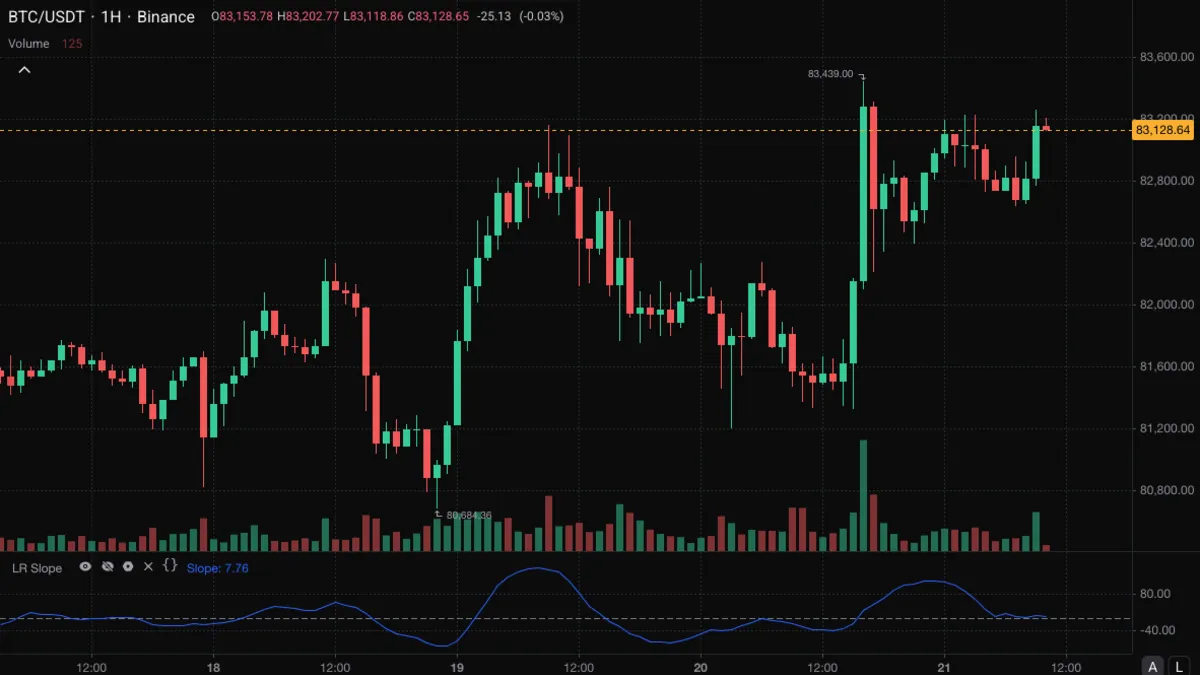
The slope of the best-fit straight line through recent closes, in price per bar, showing which way and how fast the fitted trend is moving.
View indicator
Indicator
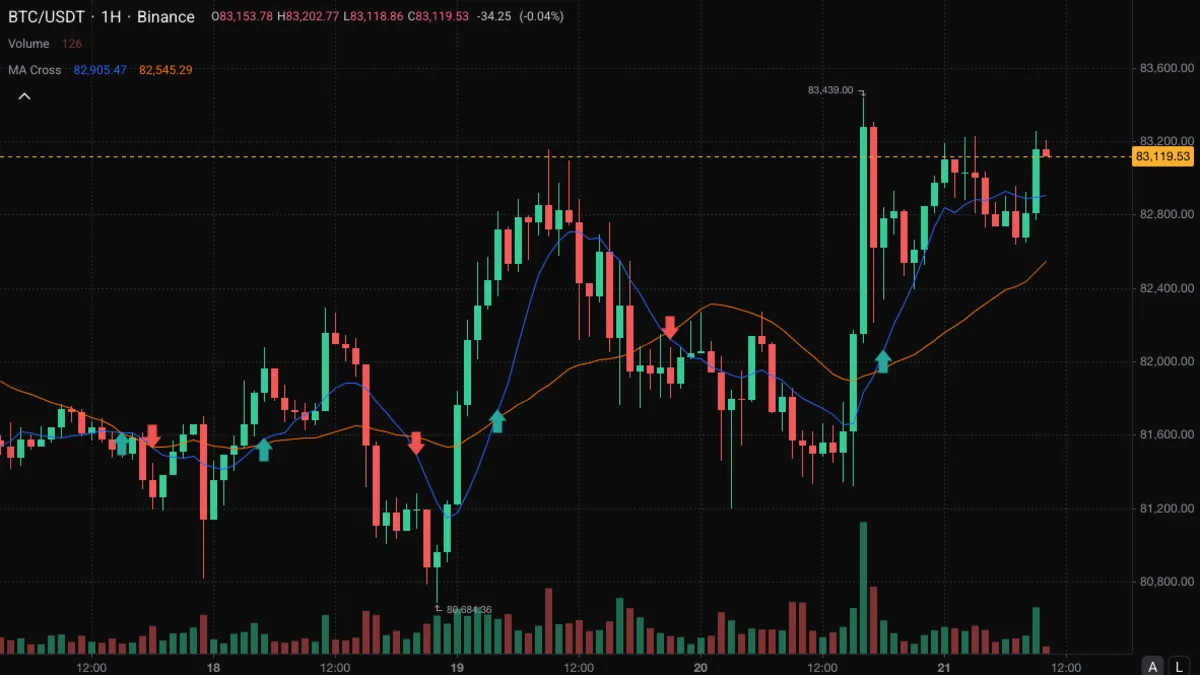
A fast and a slow simple moving average with every crossing marked by an arrow, so a change in their order is easy to spot.
View indicator
Indicator
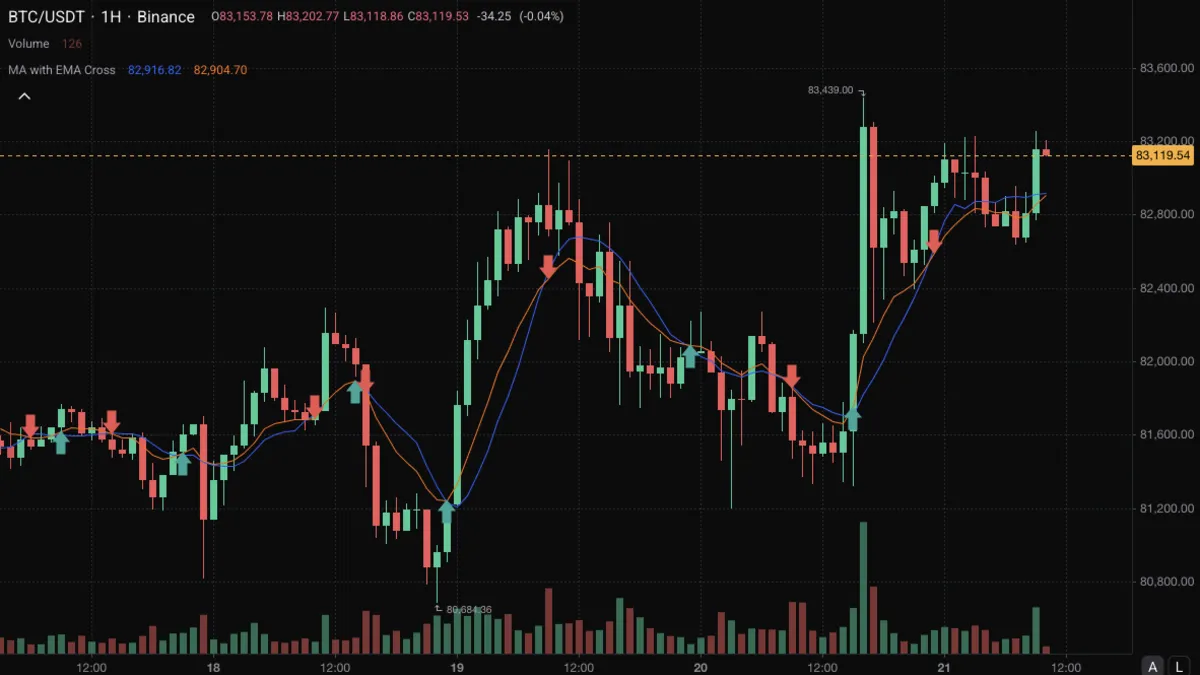
A simple and an exponential average of the same length with their crossings marked, flagging when the recent part of the window diverges from the whole.
View indicator
Indicator
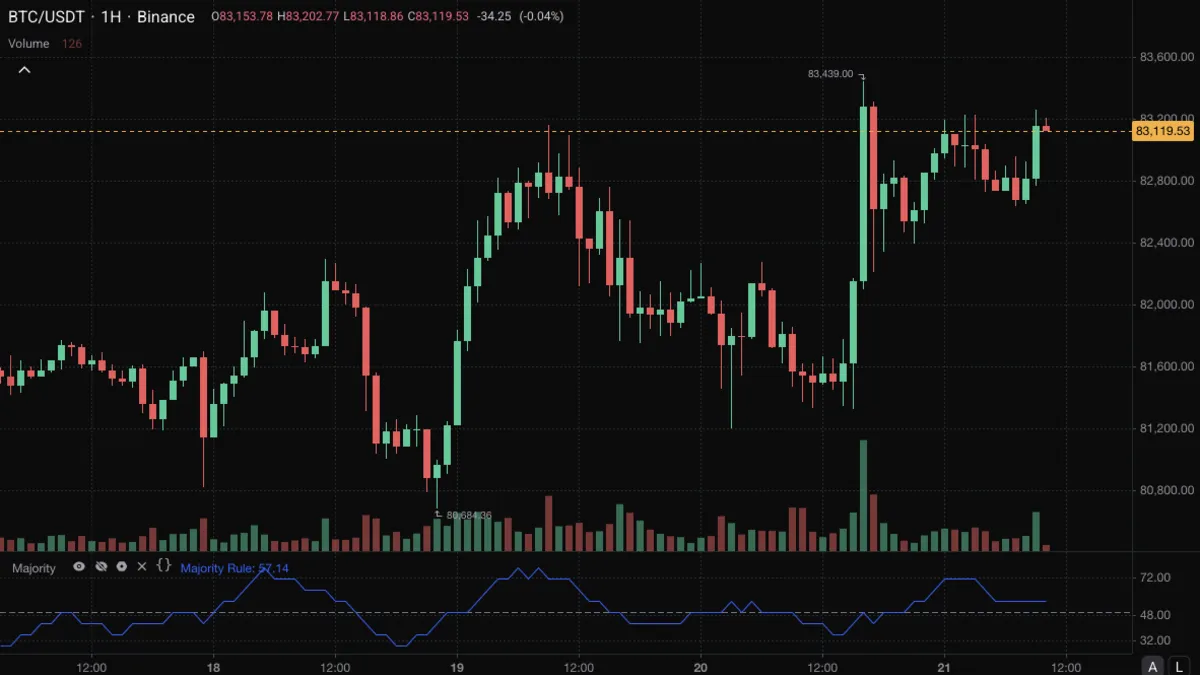
The percentage of recent bars that closed higher than the bar before, which shows how persistent a move has been rather than how large.
View indicator
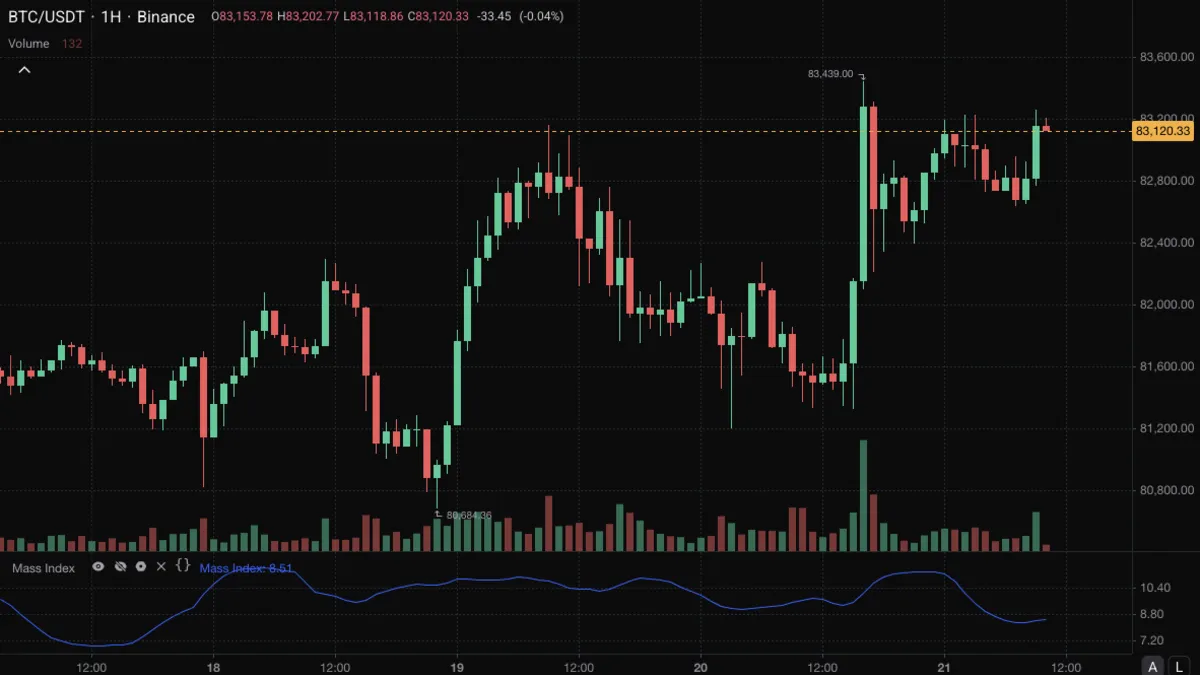
Indicator
Tracks whether the high-low range of the bars is widening, which is used as an early warning that a trend may be about to turn.
View indicator
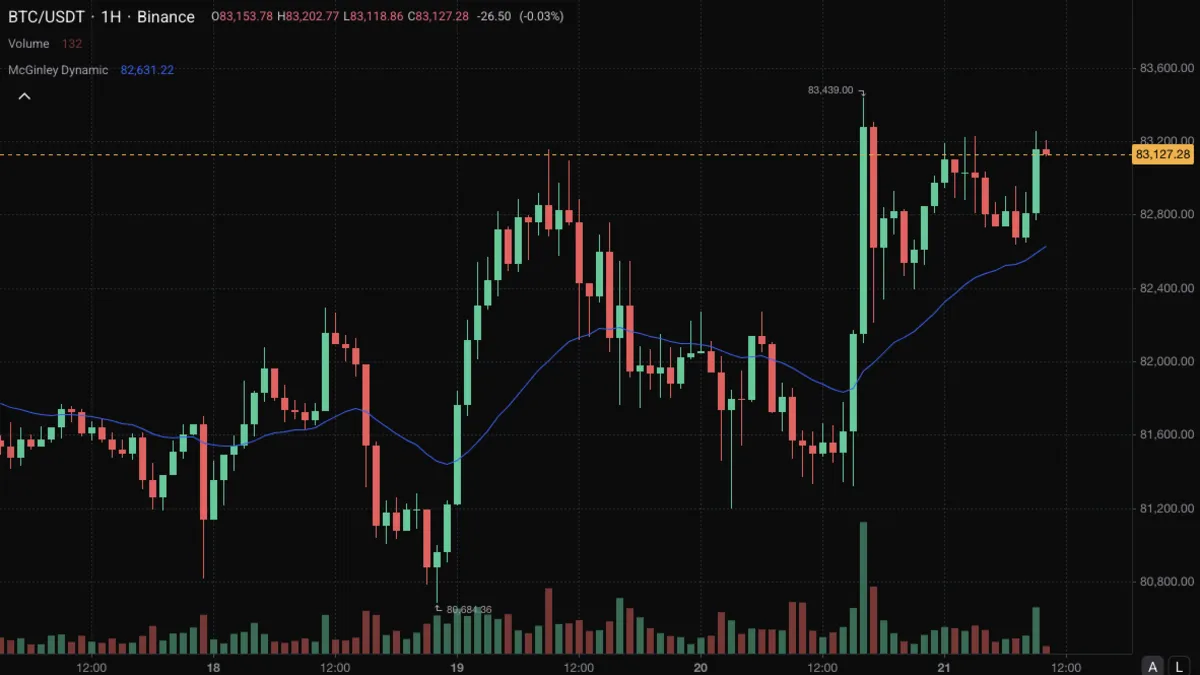
Indicator
A moving average that adjusts its own speed to the distance between price and the line, following falling prices faster than rising ones.
View indicator
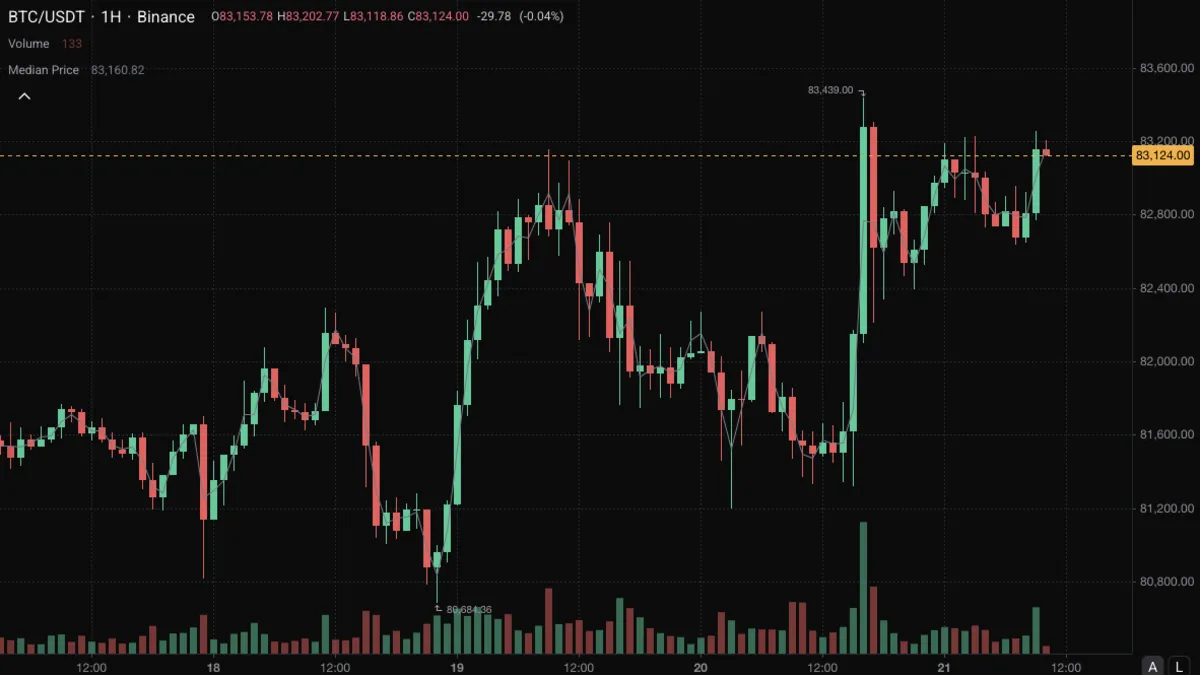
Indicator
The midpoint of each bar's high and low, drawn as a line, showing the centre of the range regardless of where the bar opened or closed.
View indicator
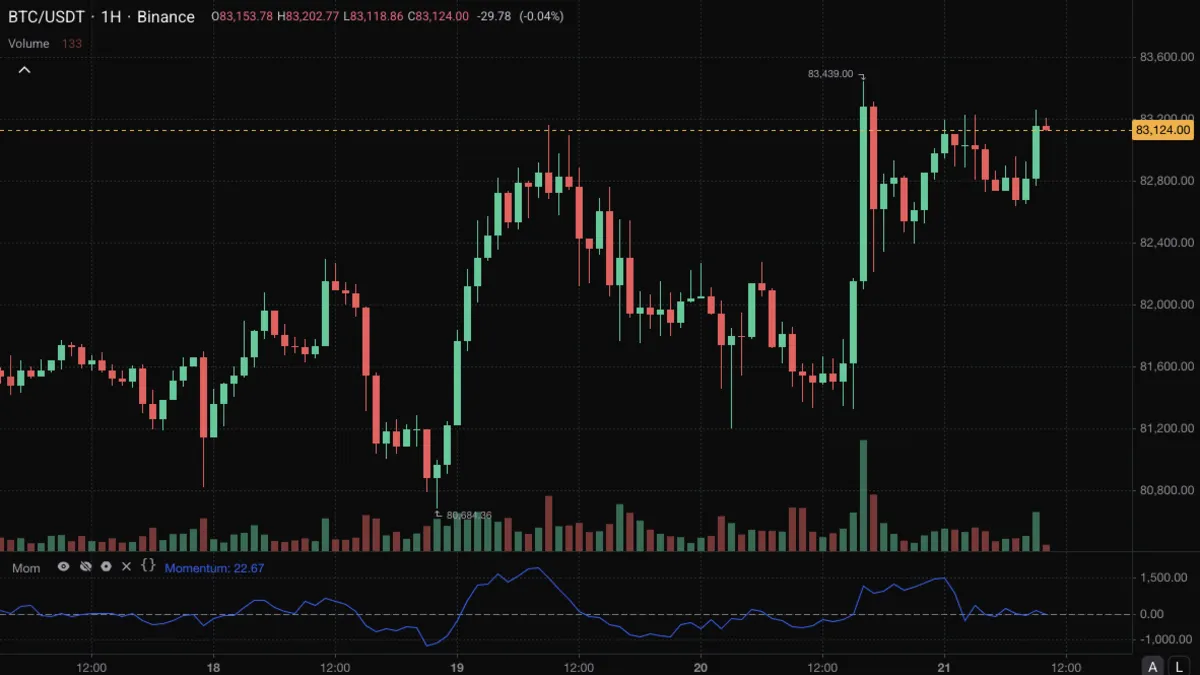
Indicator
The change in price over a fixed number of bars, in price units, which shows the direction and pace of a move.
View indicator
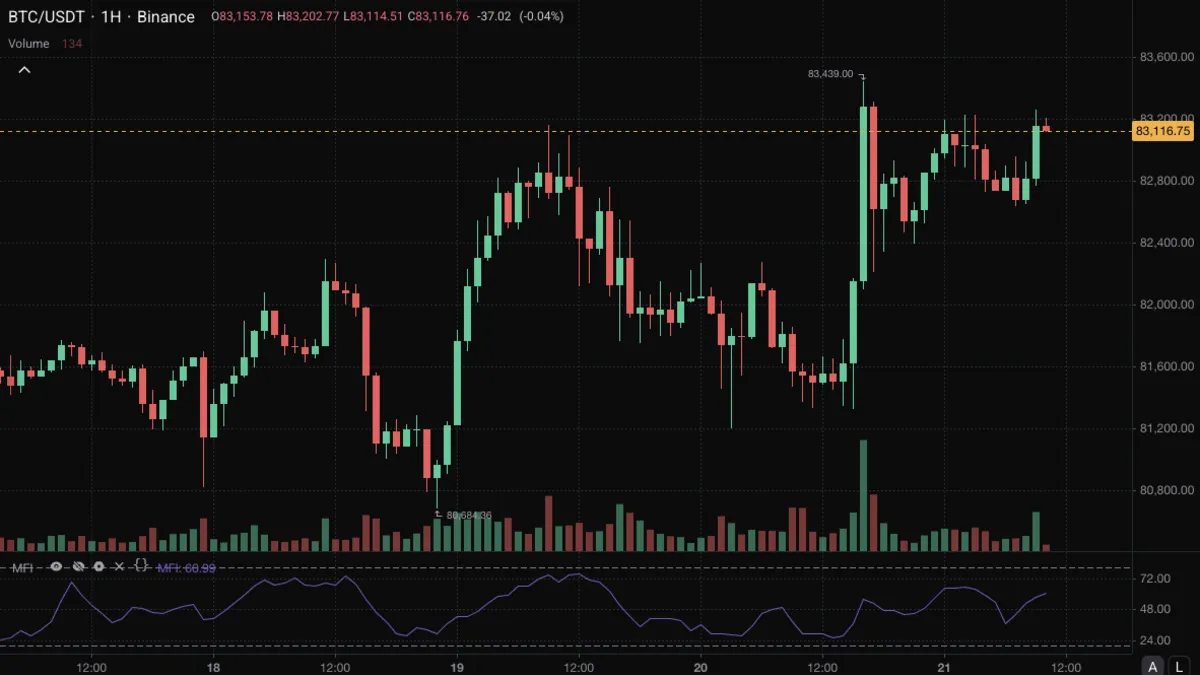
Indicator
A 0 to 100 oscillator that weighs rising and falling typical price by volume, often described as a volume-weighted RSI.
View indicator
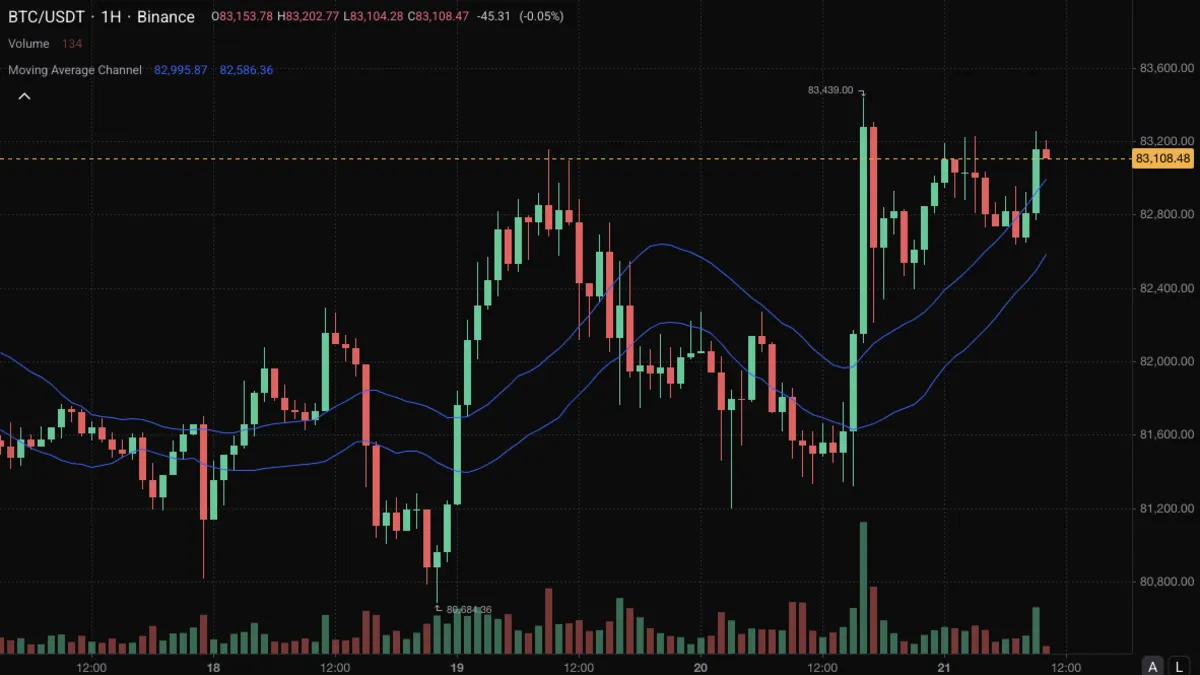
Indicator
An average of the highs and an average of the lows, giving a band as wide as the typical bar range of recent candles.
View indicator
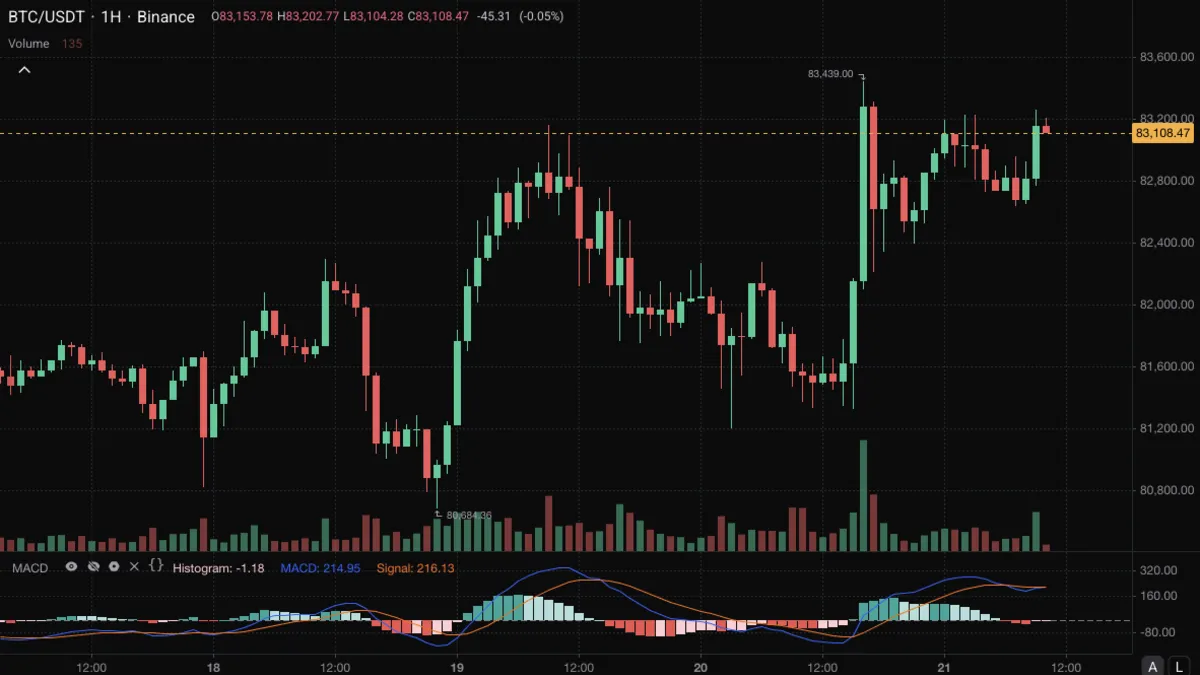
Indicator
The gap between a fast and a slow exponential average, with a signal line and a histogram, used to read the direction and pace of a trend.
View indicator
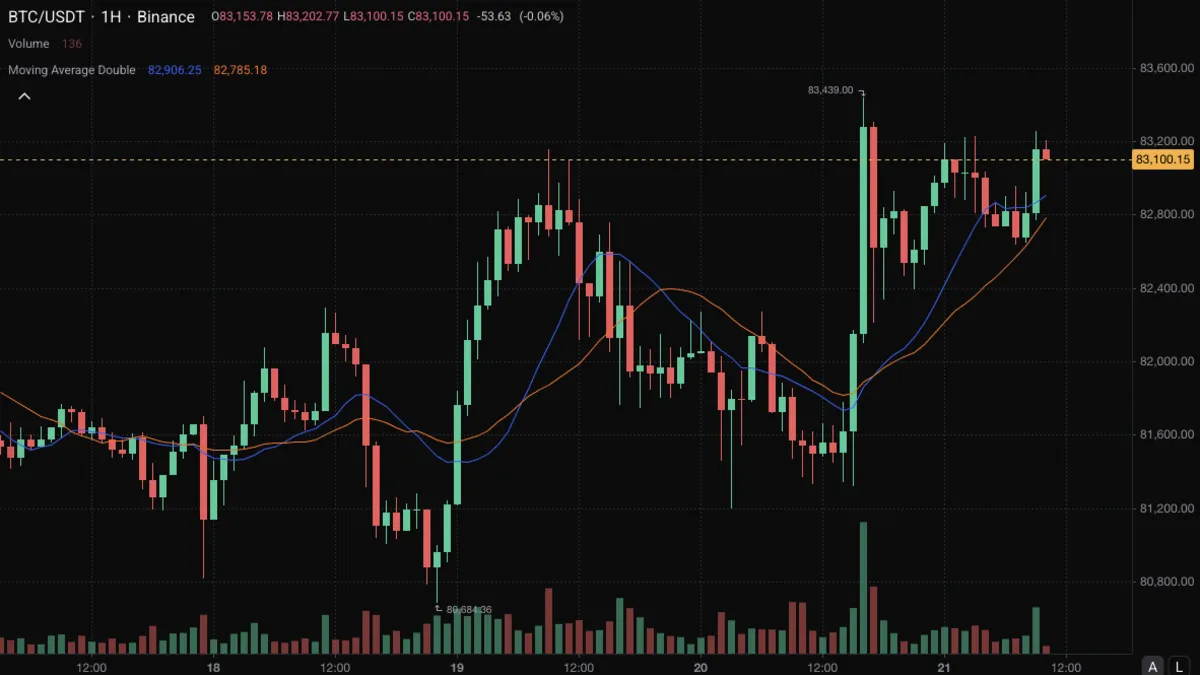
Indicator
Two moving averages of the same price at different lengths, sharing one method, so the faster and slower view can be compared on one chart.
View indicator
Indicator
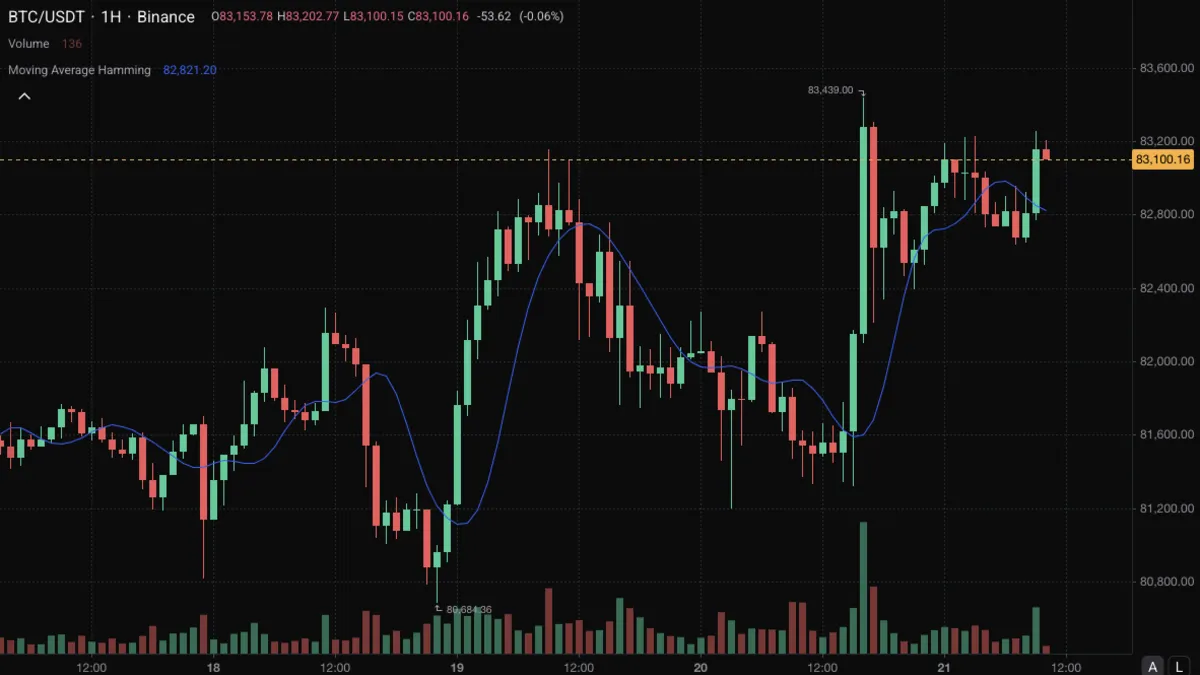
A very smooth average that weights the middle of its window most and both ends least, useful when a clean line matters more than speed.
View indicator
Indicator
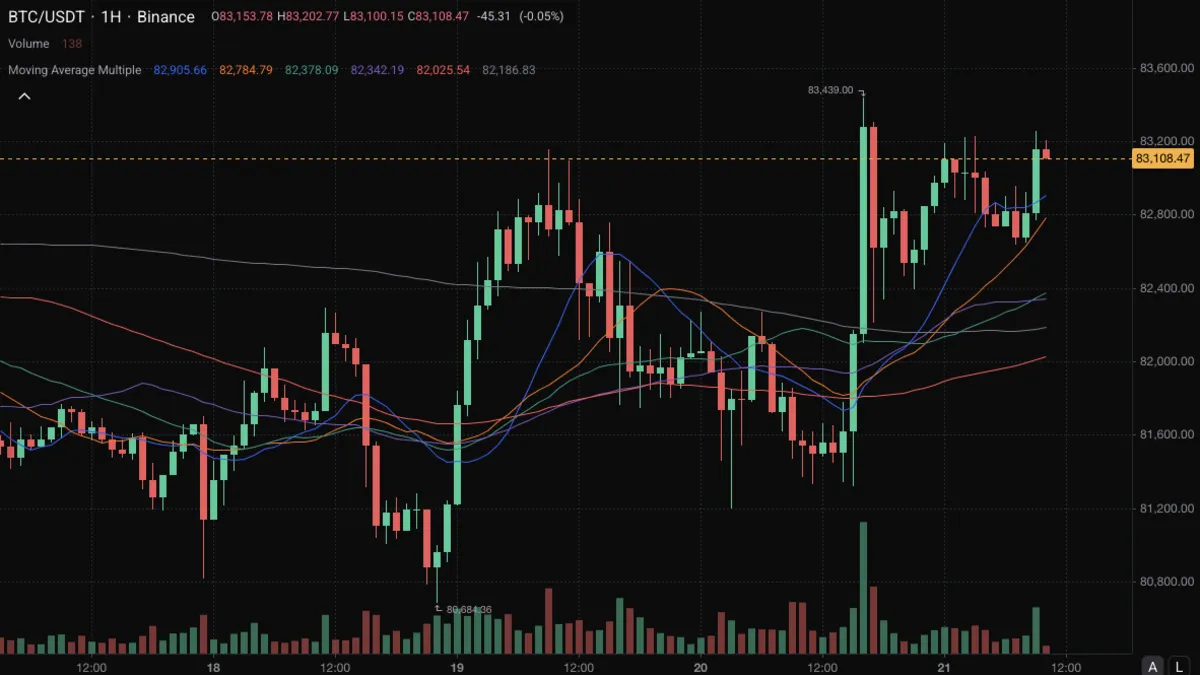
Six moving averages from 14 to 200 bars sharing one method, so the spacing between short and long horizons shows how mature a trend is.
View indicator
Indicator
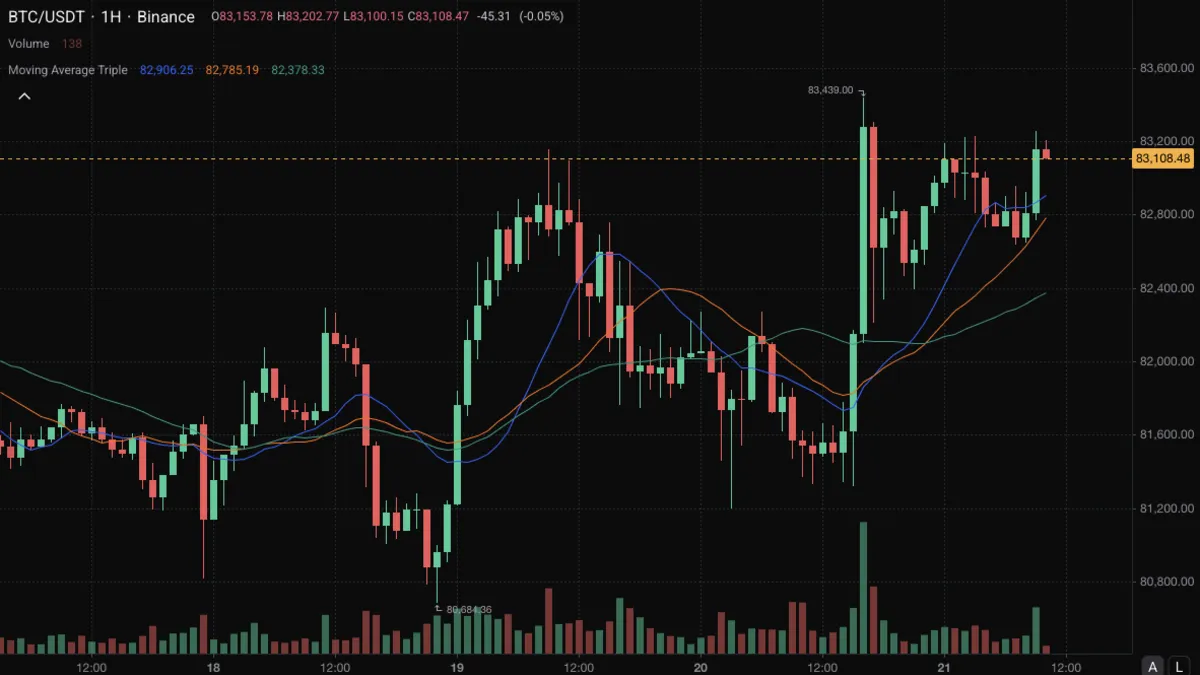
Three moving averages of the same price at short, medium and longer lengths, sharing one method so their order and spacing can be read together.
View indicator
Indicator
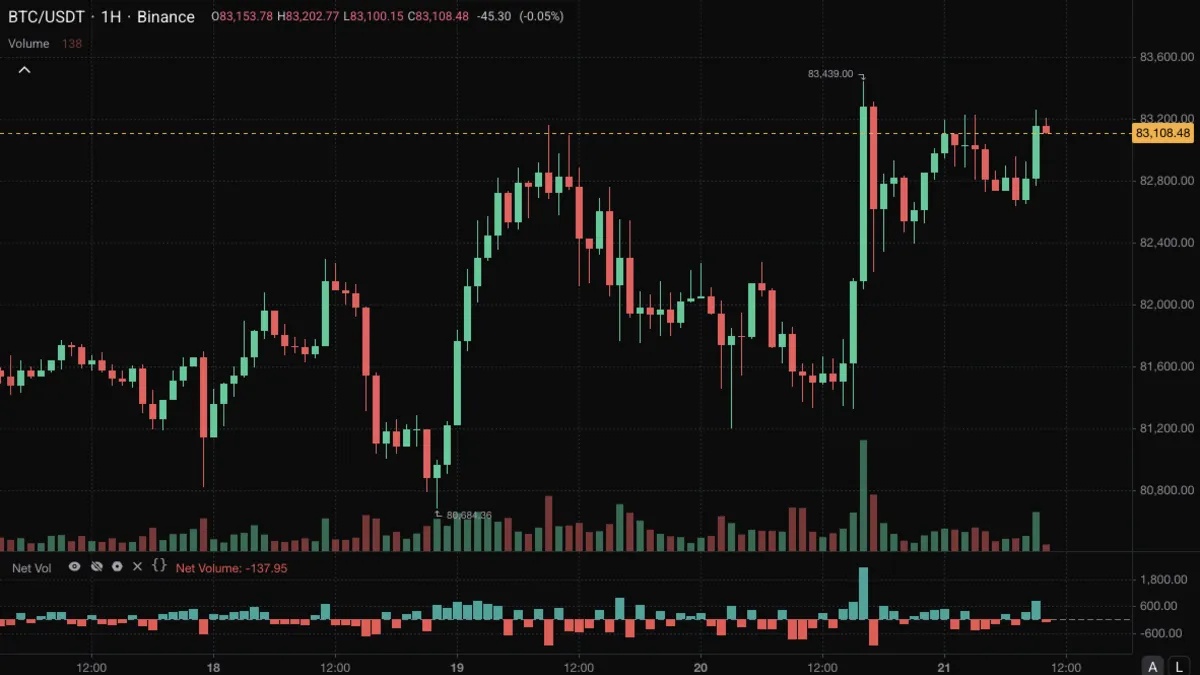
Each bar's volume given a plus or minus sign by whether the close was up or down, so you can see which side the volume came in on.
View indicator
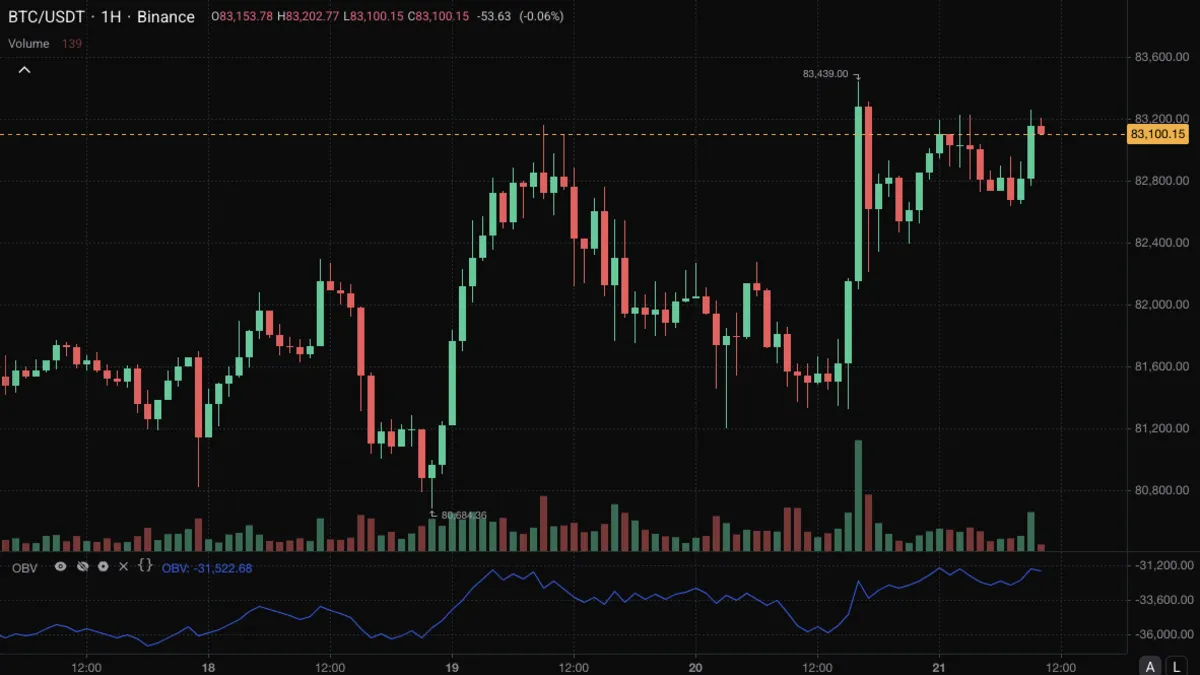
Indicator
A running total of volume, added on up closes and subtracted on down closes, used to see whether volume is backing the price trend.
View indicator
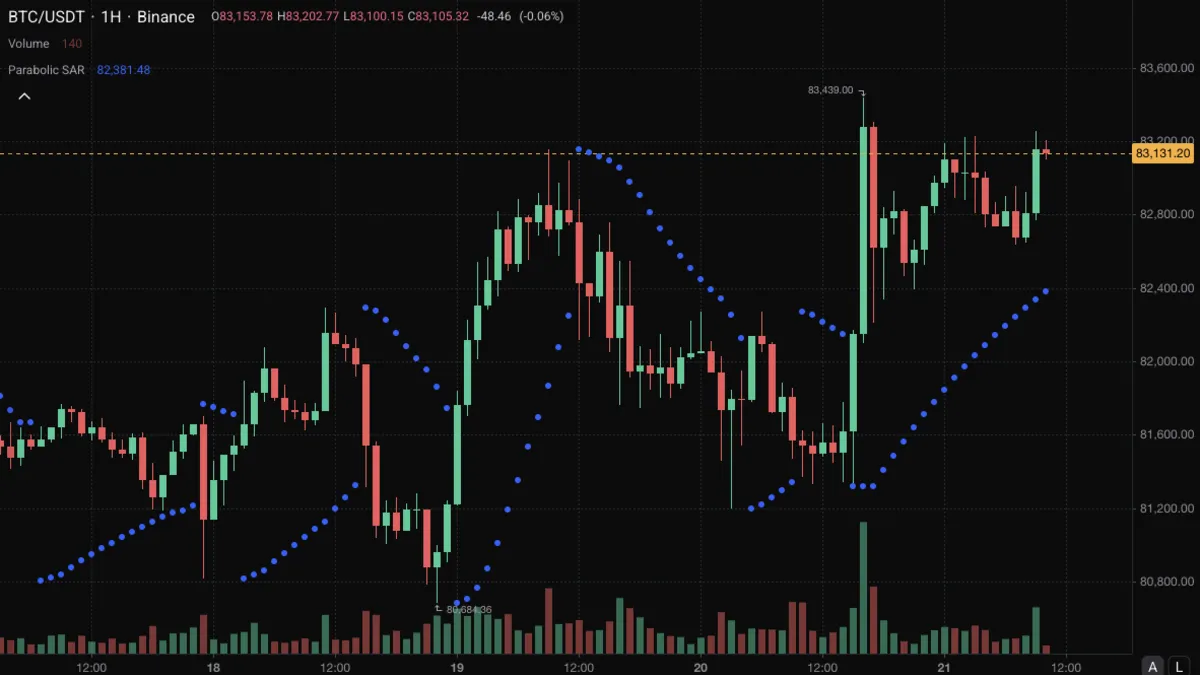
Indicator
Dots that trail price and close in faster as a trend extends, flipping to the other side when price crosses them.
View indicator
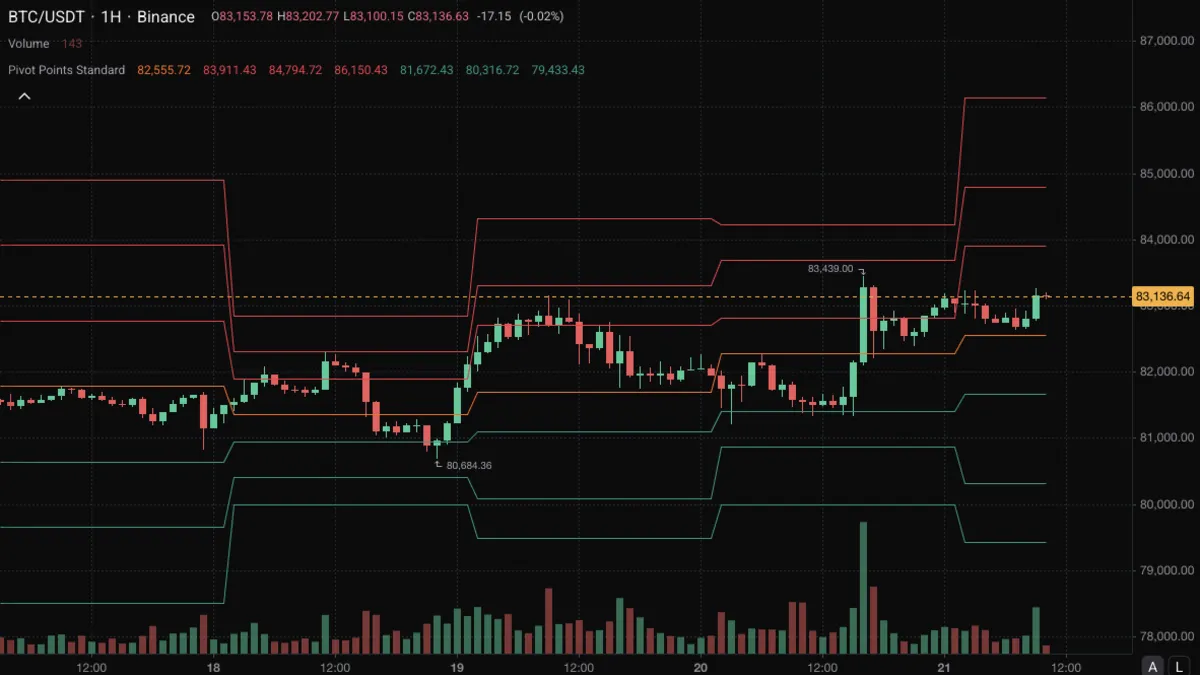
Indicator
Seven fixed support and resistance levels for the current day, week or month, calculated from the previous period's high, low and close.
View indicator
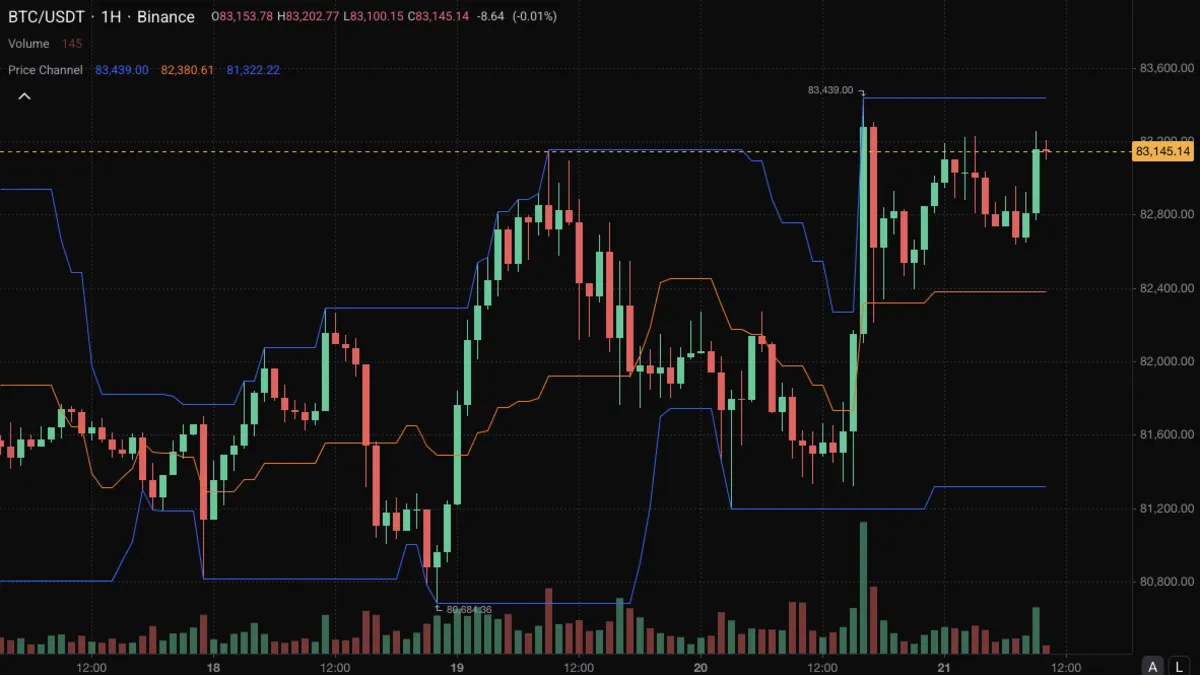
Indicator
The highest high and lowest low of recent bars with their midpoint, which can be shifted sideways to use the channel as a reference level for later bars.
View indicator
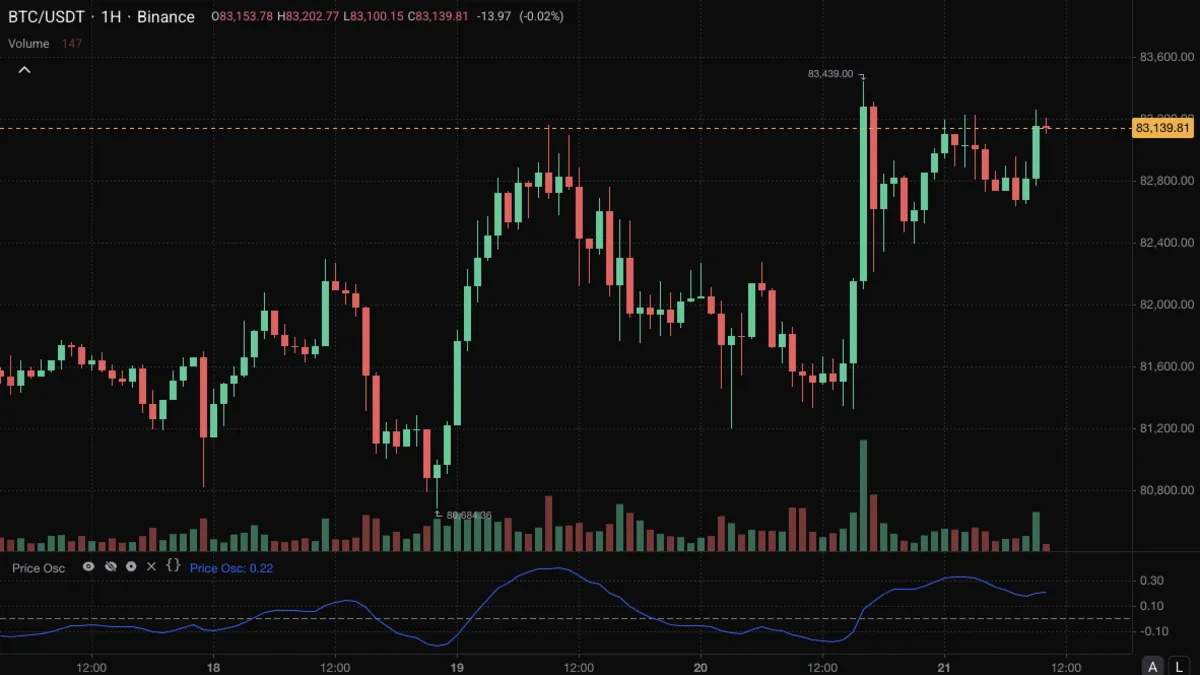
Indicator
The gap between a fast and a slow exponential average as a percentage of the slow one, so its size can be compared across markets.
View indicator
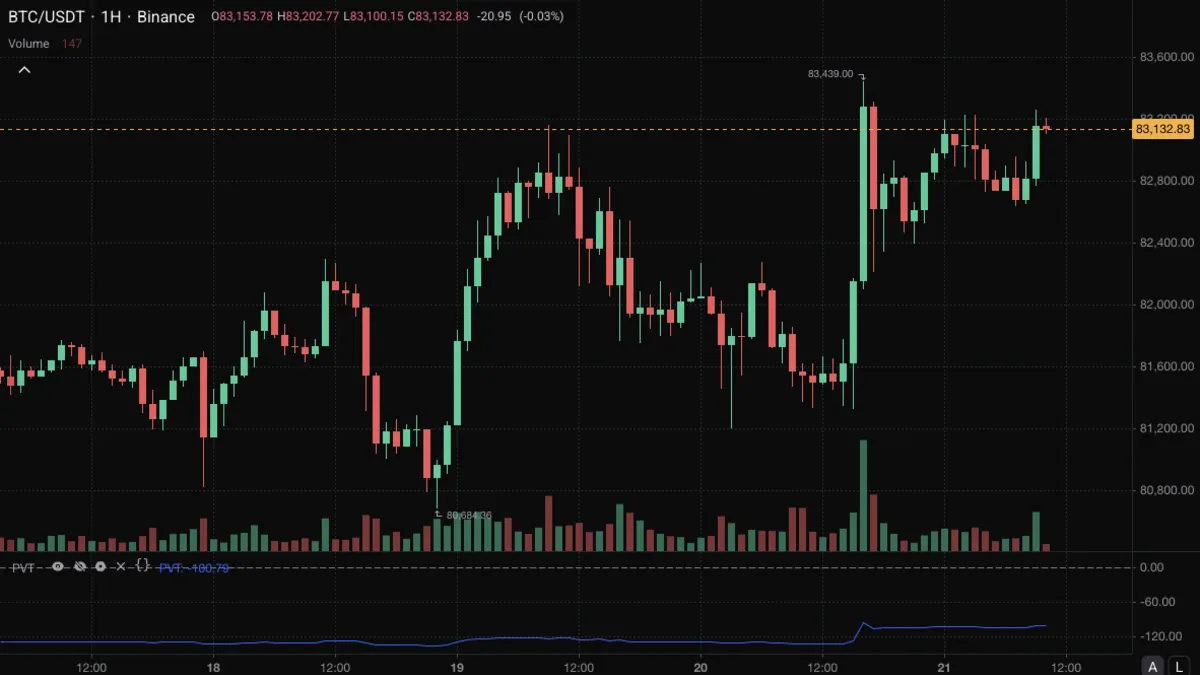
Indicator
A running total of volume weighted by the percentage change in the close, so larger moves on heavier volume move the line further.
View indicator
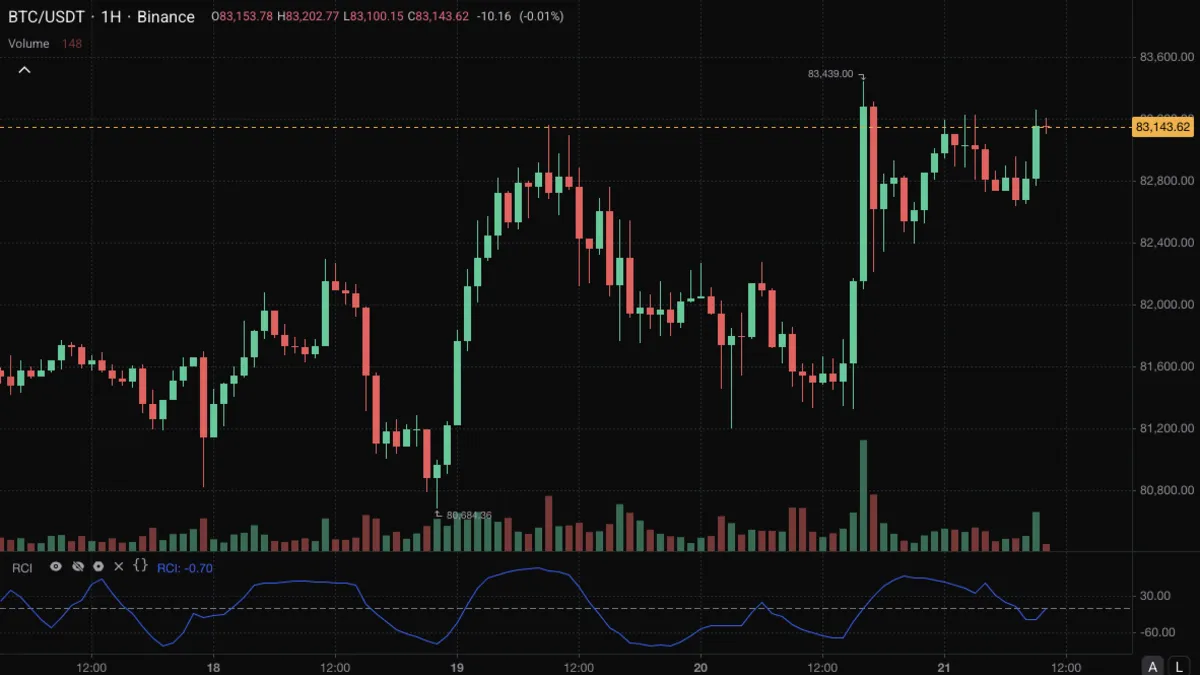
Indicator
A rank correlation between price and time, from -100 to +100, showing how consistently each bar has been higher or lower than the ones before it.
View indicator
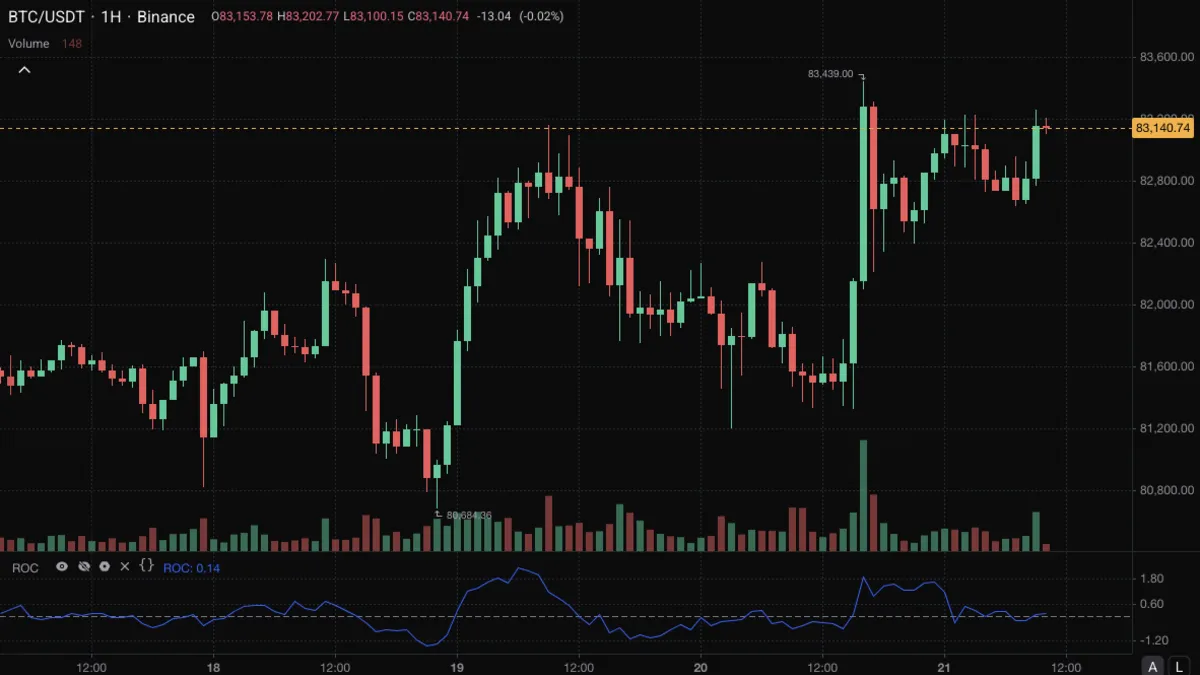
Indicator
The percentage change in price over a set number of bars, a momentum line around zero that compares fairly across markets and price levels.
View indicator
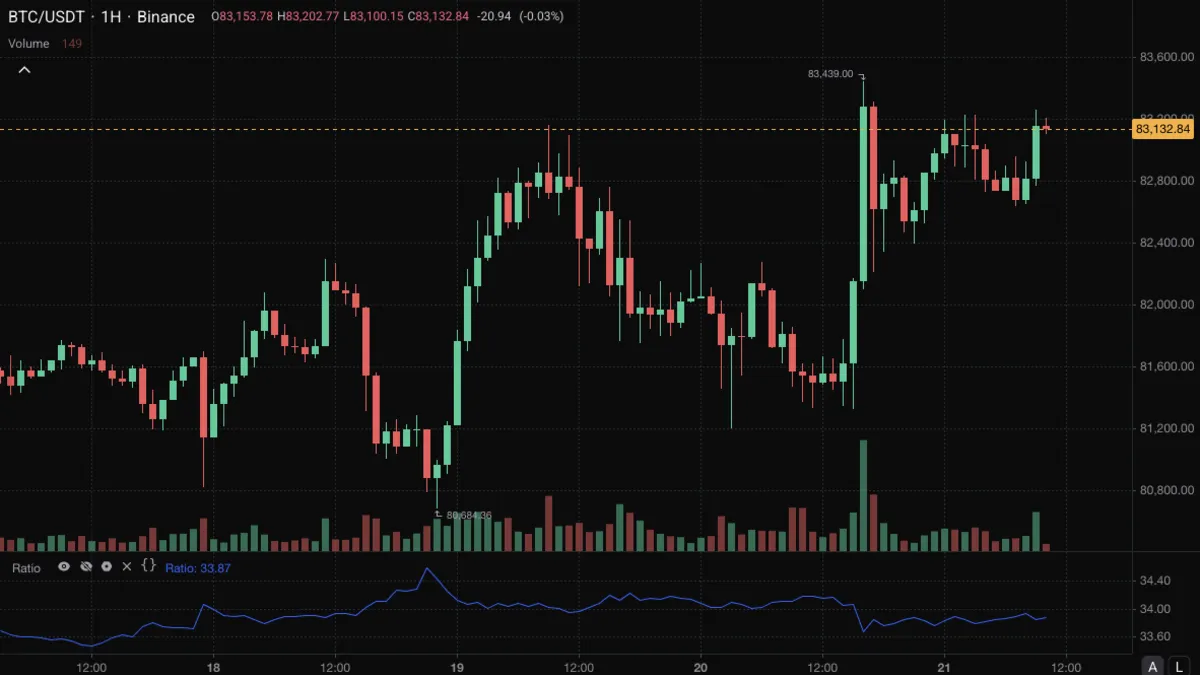
Indicator
This market's close divided by another market's close, rising when this market is outperforming the other and falling when it lags.
View indicator
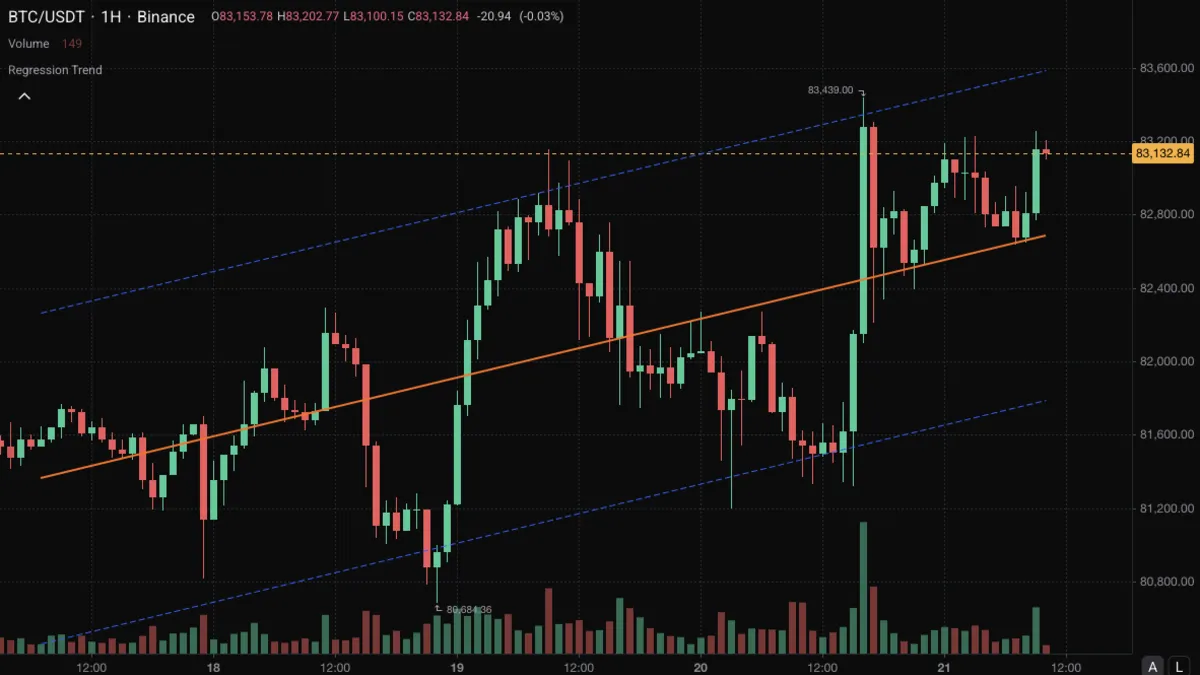
Indicator
A straight best-fit line through the closes of the last 100 bars with parallel bands above and below, showing the recent trend and how far price strays from it.
View indicator
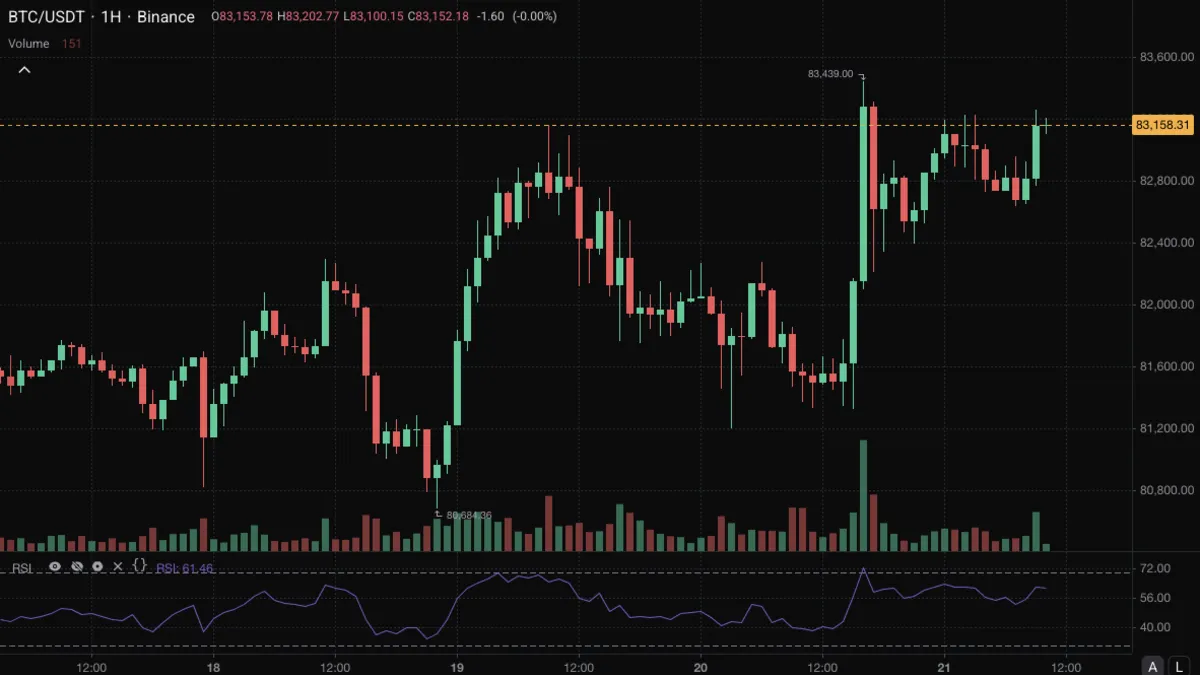
Indicator
A 0 to 100 reading of average gains against average losses, used to judge how stretched a move has become.
View indicator
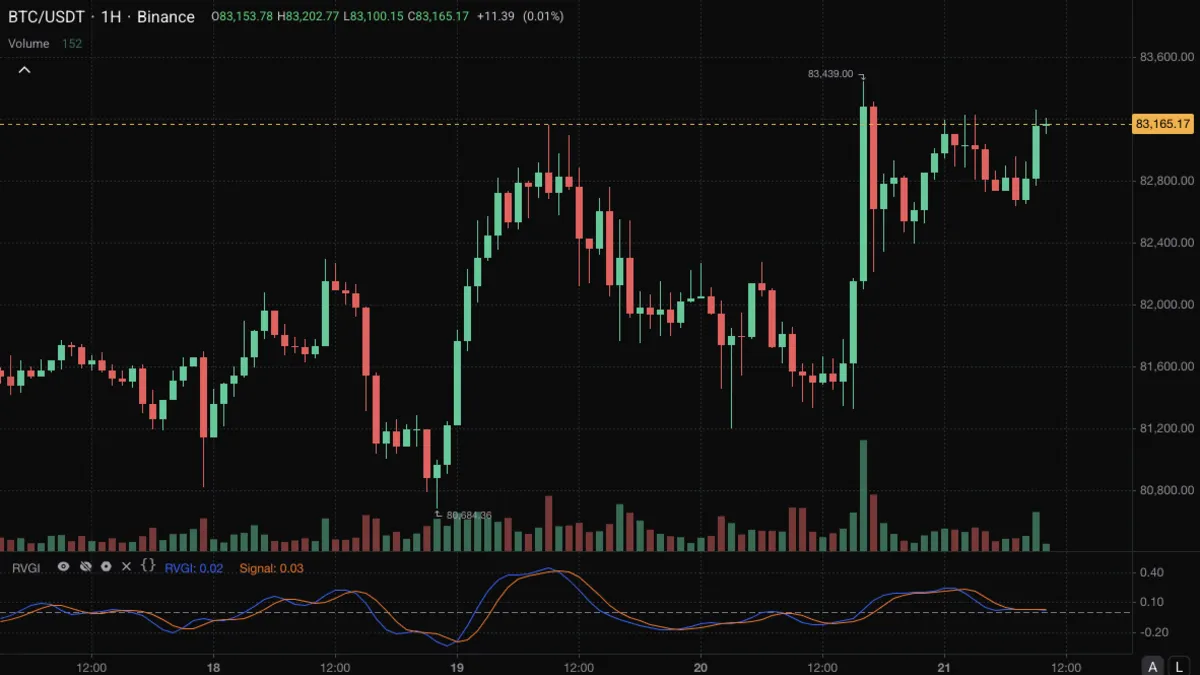
Indicator
Measures how far bars close from their open as a share of their range, smoothed, on the idea that closes tend to finish above opens in uptrends.
View indicator
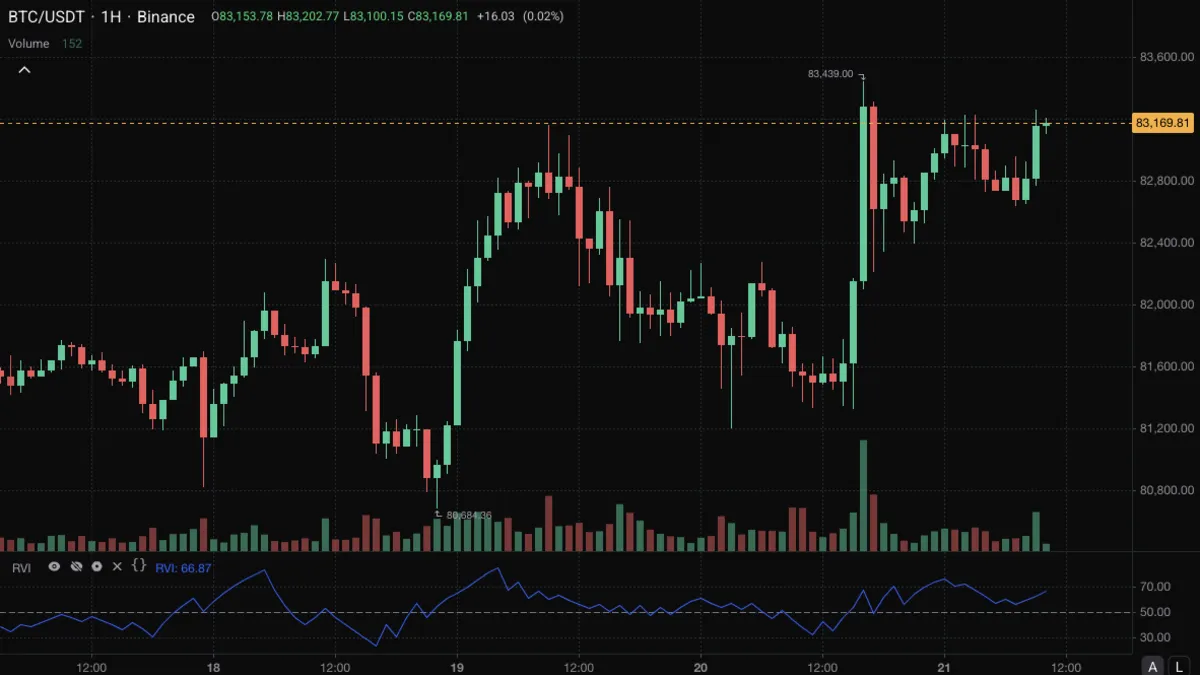
Indicator
Shows what share of recent volatility came on up bars, on a 0 to 100 scale, as a check on whether the active bars are the rising or the falling ones.
View indicator
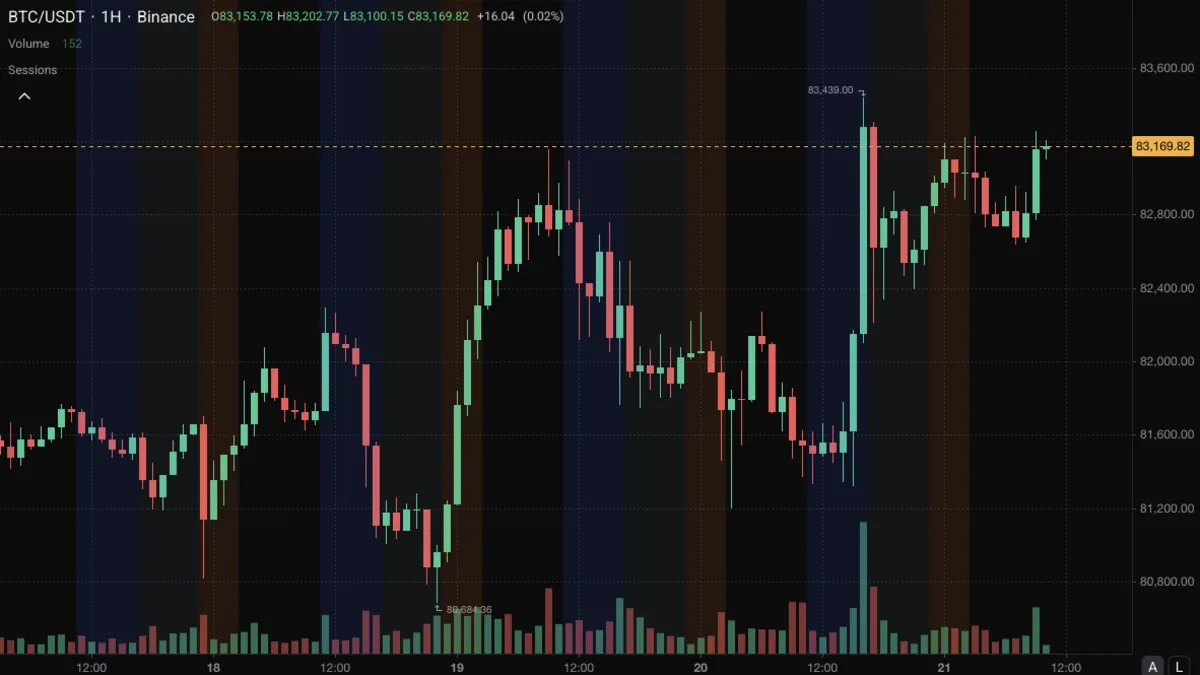
Indicator
Shades the chart background during pre-market, regular and post-market hours, so you can see which bars fell inside each trading session.
View indicator
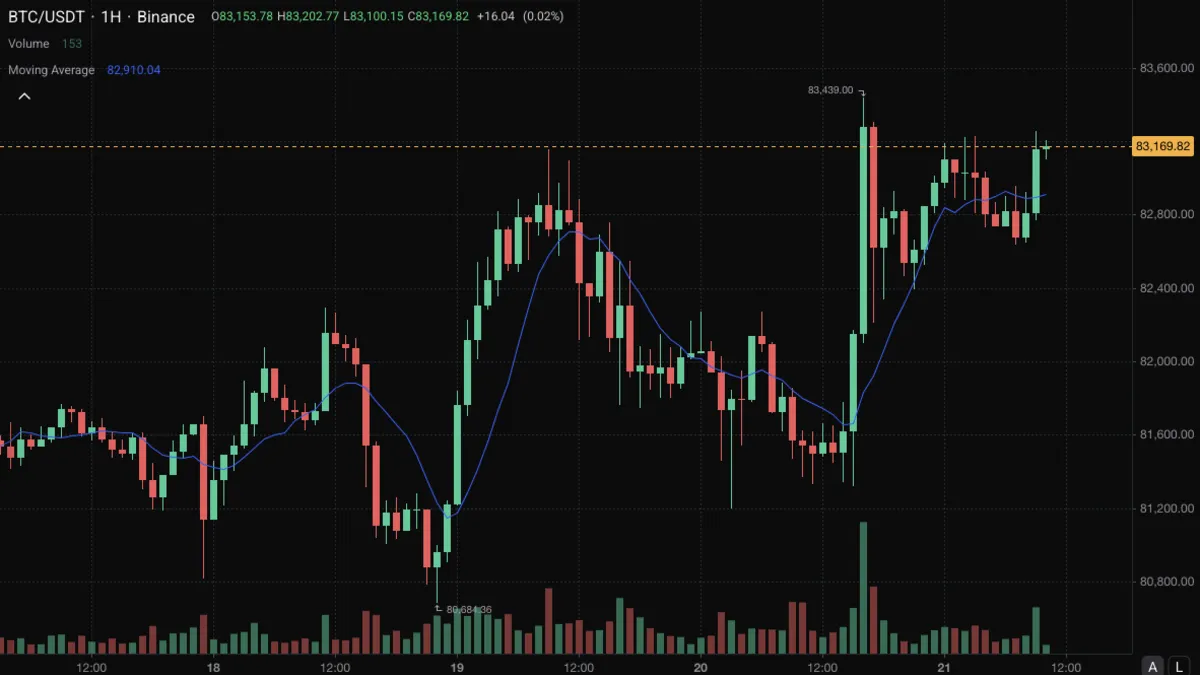
Indicator
The plain average of the last n prices, every bar counted equally, which gives a smooth line for judging trend direction.
View indicator
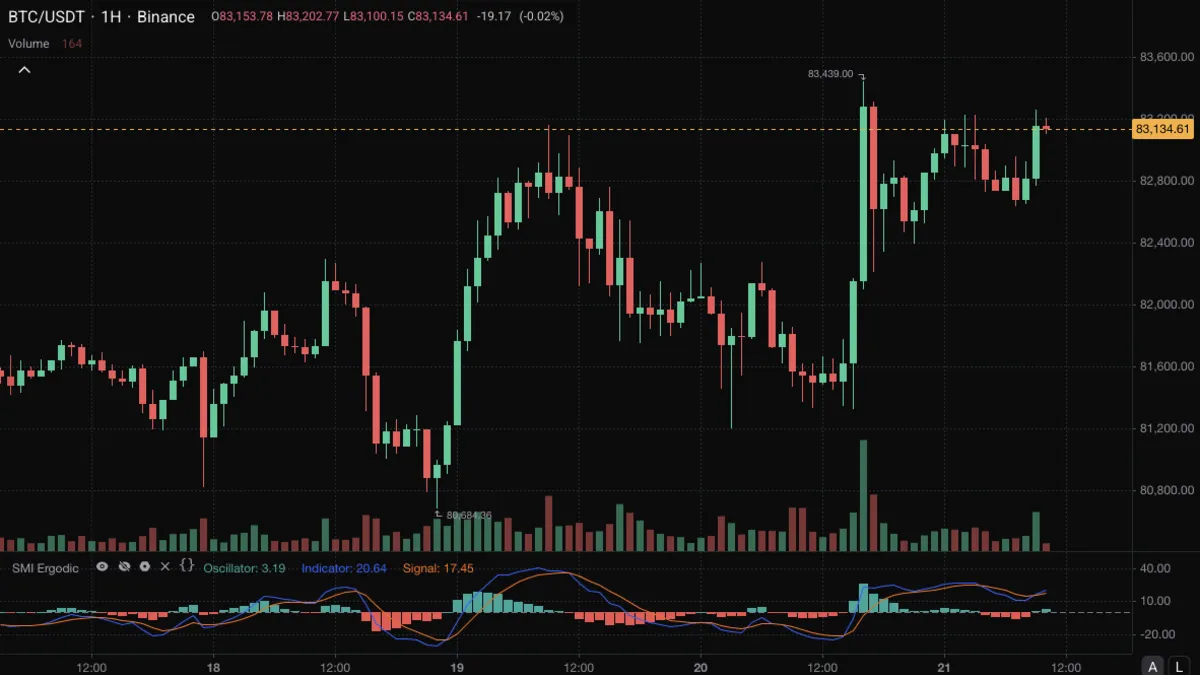
Indicator
A faster True Strength Index with a signal line and a histogram of their difference, used to read the direction and turns of momentum.
View indicator
Indicator
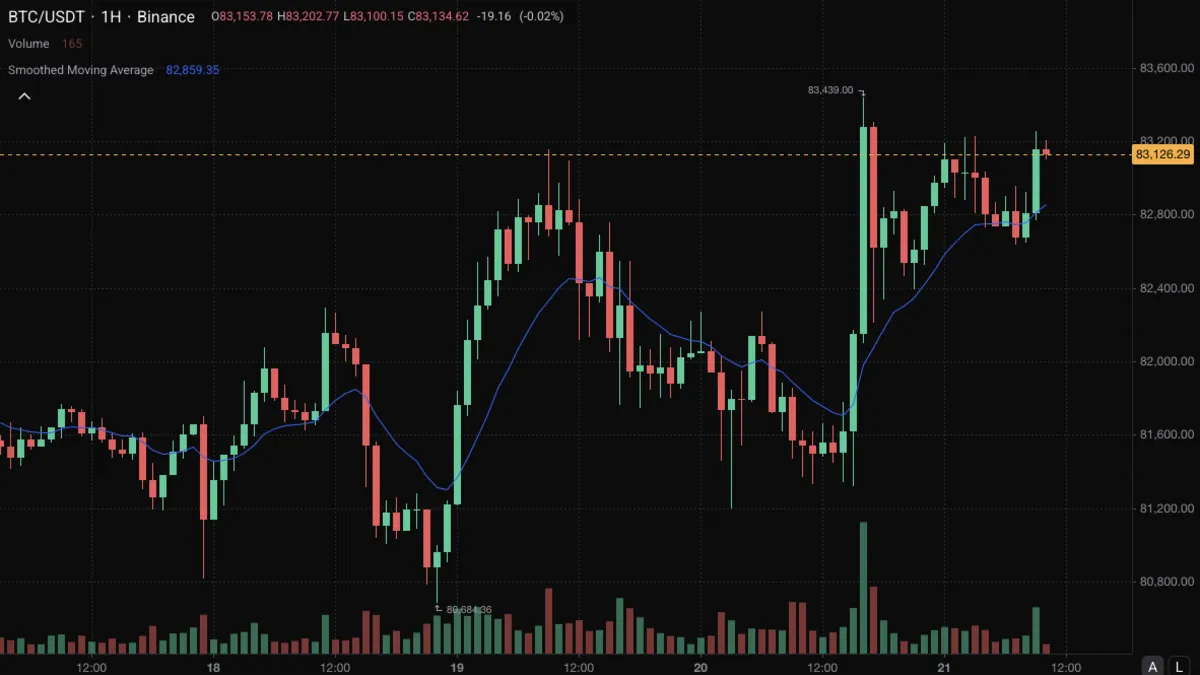
Wilder's smoothing as a standalone line, an exponential-style average with a slower decay, started from a plain average.
View indicator
Indicator
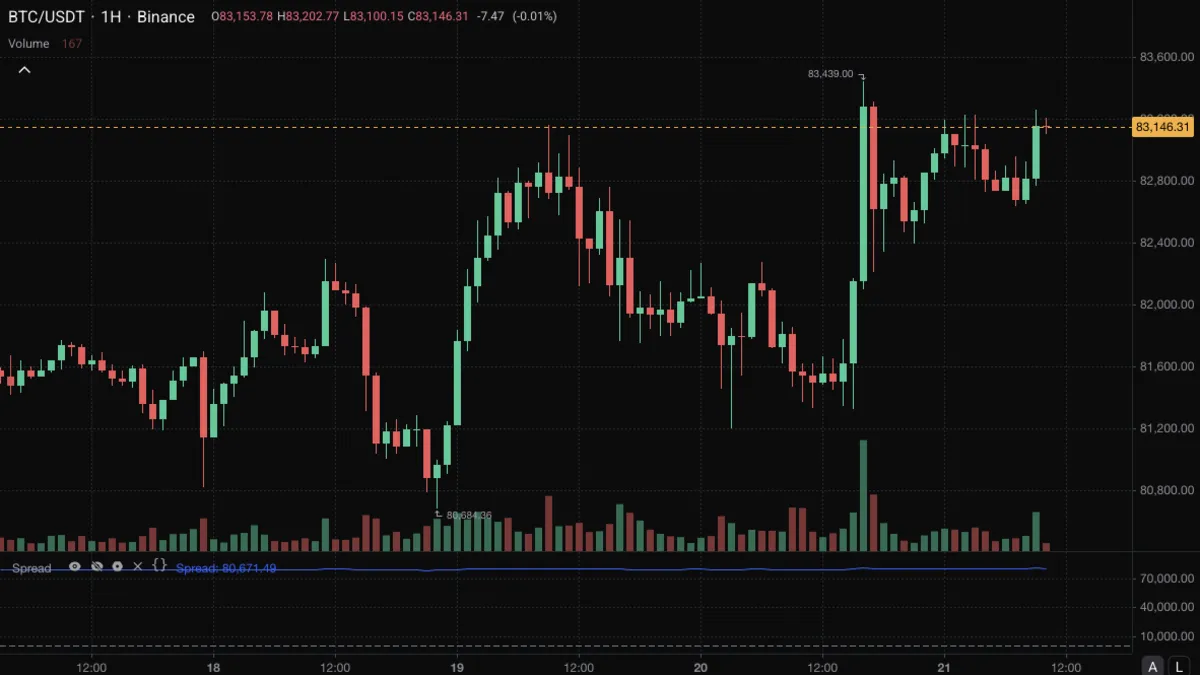
This market's close minus another market's close, in price units, for comparing two instruments that should trade at about the same price.
View indicator
Indicator
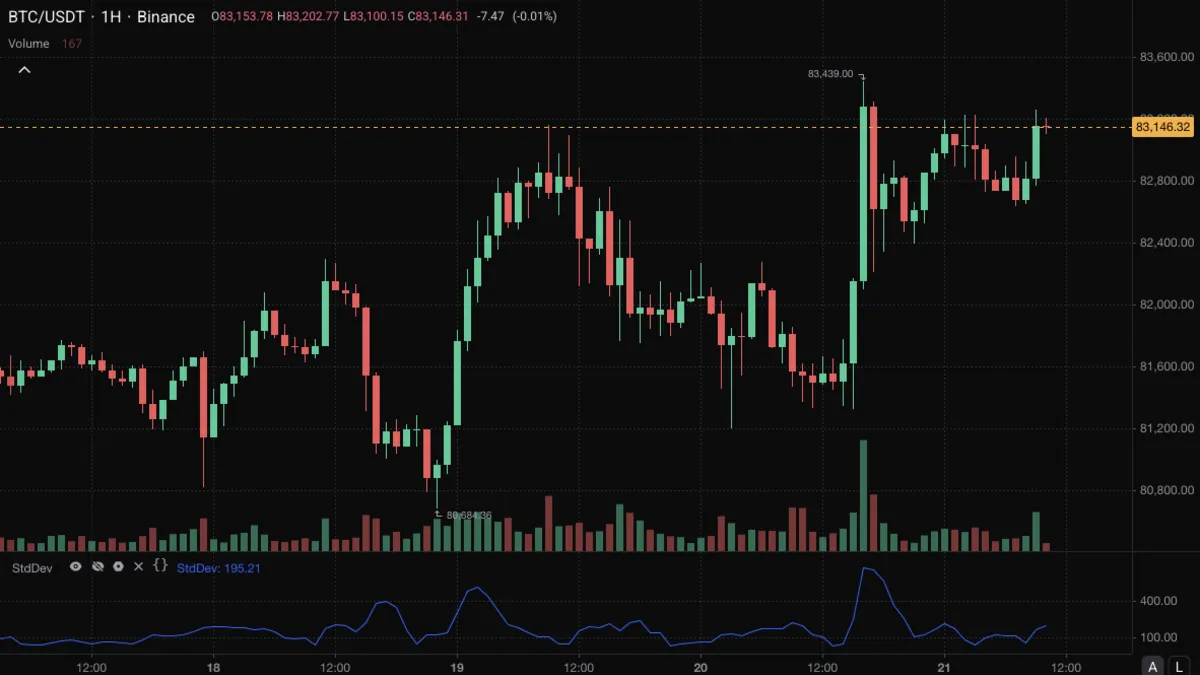
How far recent closes typically sit from their own average, in price units, as a plain read of how much price is spreading out.
View indicator
Indicator
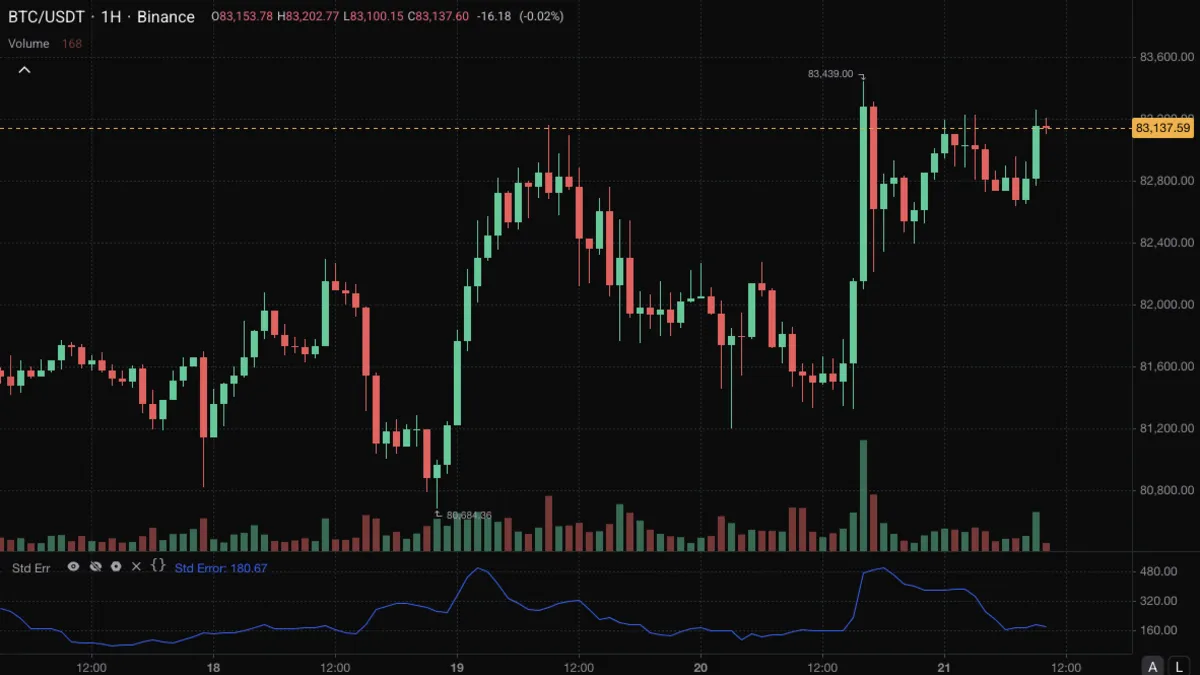
How far recent closes typically sit from their own straight-line trend, which separates an orderly trend from a disorderly one.
View indicator
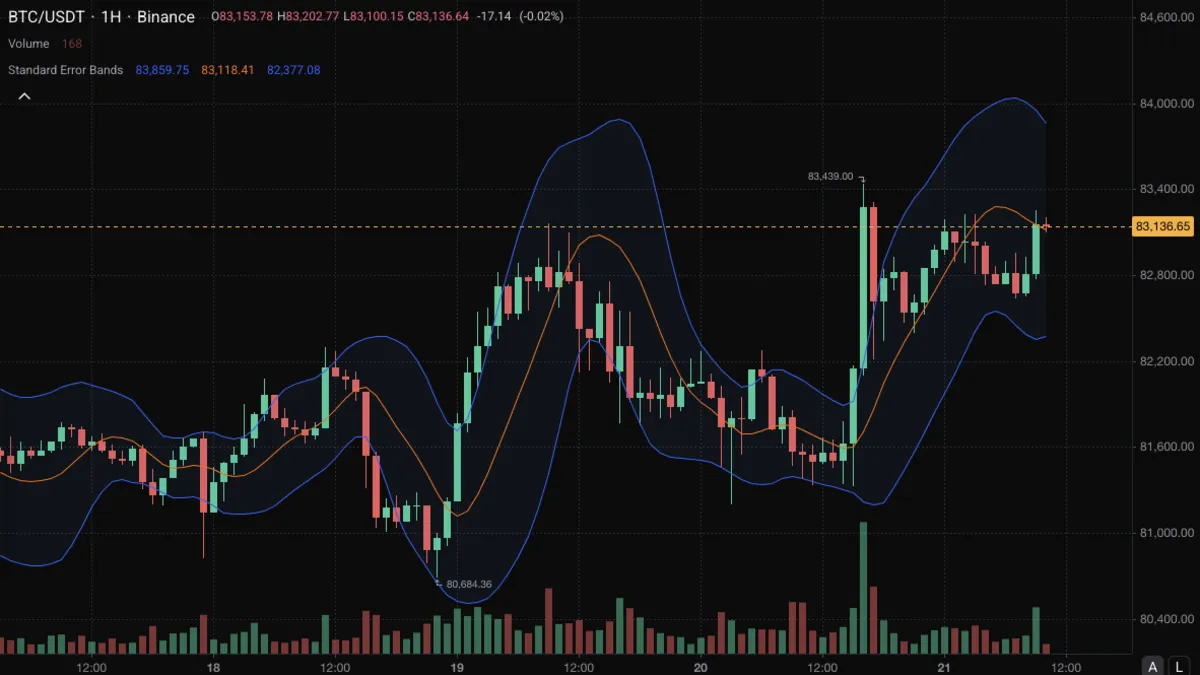
Indicator
Bands around a regression line, set by how closely price follows that line, so narrow bands mark an orderly trend rather than a quiet market.
View indicator
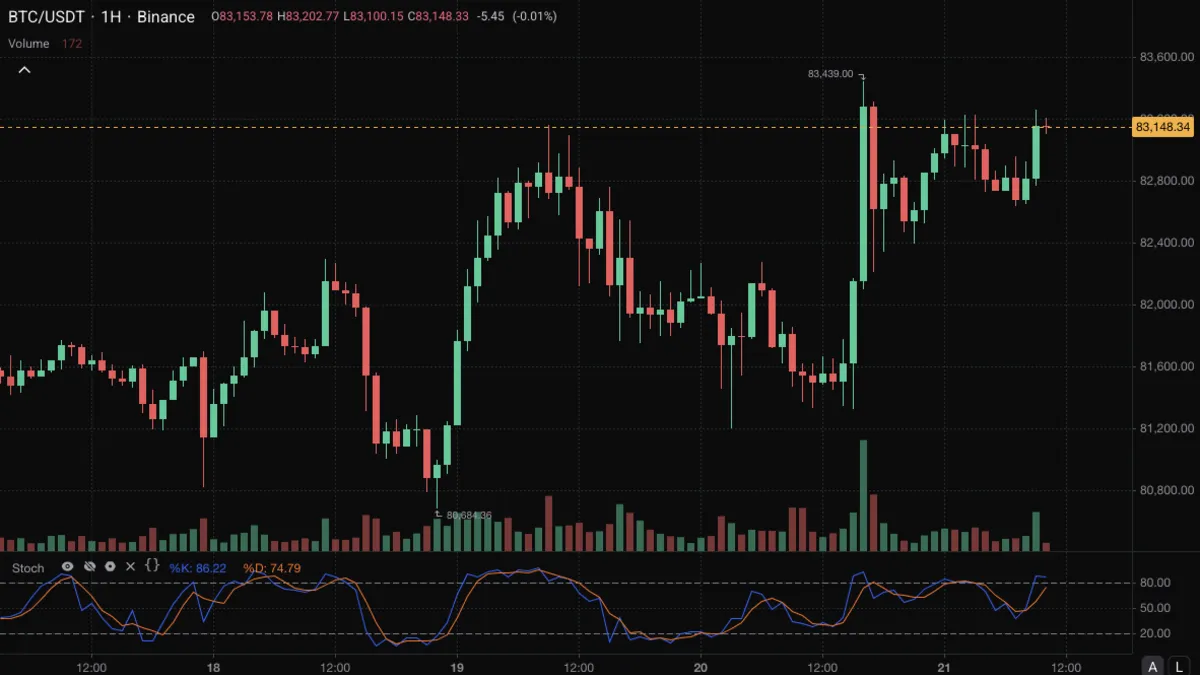
Indicator
Shows where the close sits within the recent high-low range as a percentage, with a smoothed signal line, to judge whether price is closing near its highs or its lows.
View indicator
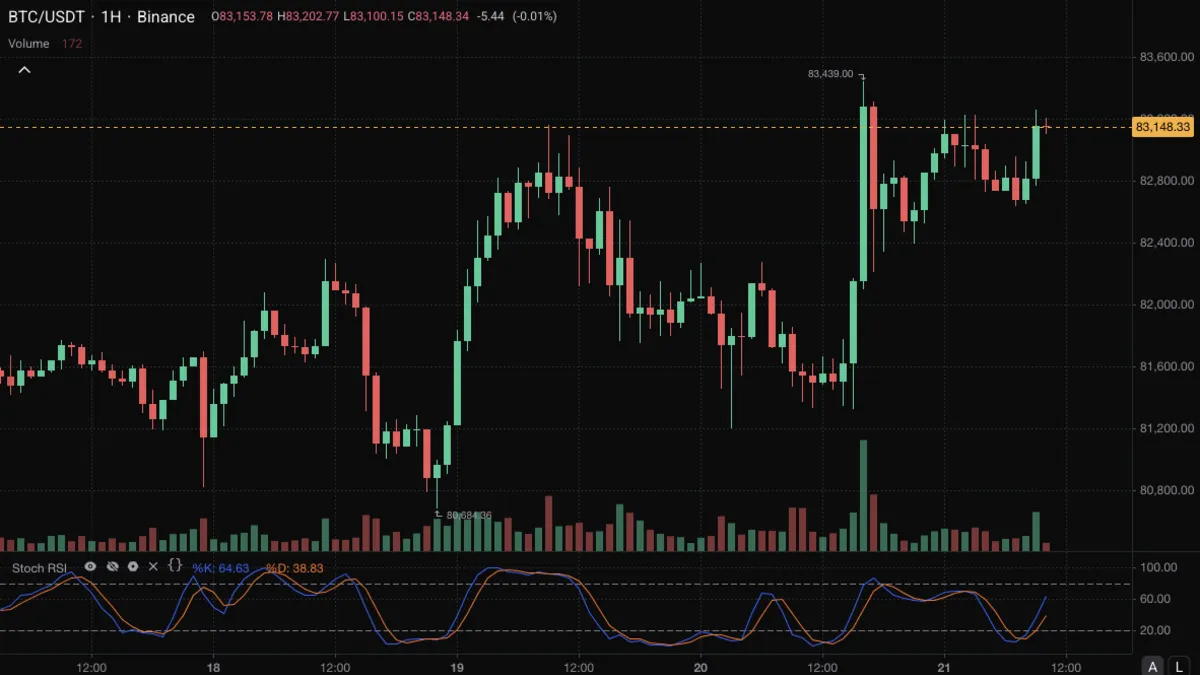
Indicator
Applies the Stochastic formula to RSI instead of price, showing where RSI sits inside its own recent range on a 0 to 100 scale.
View indicator
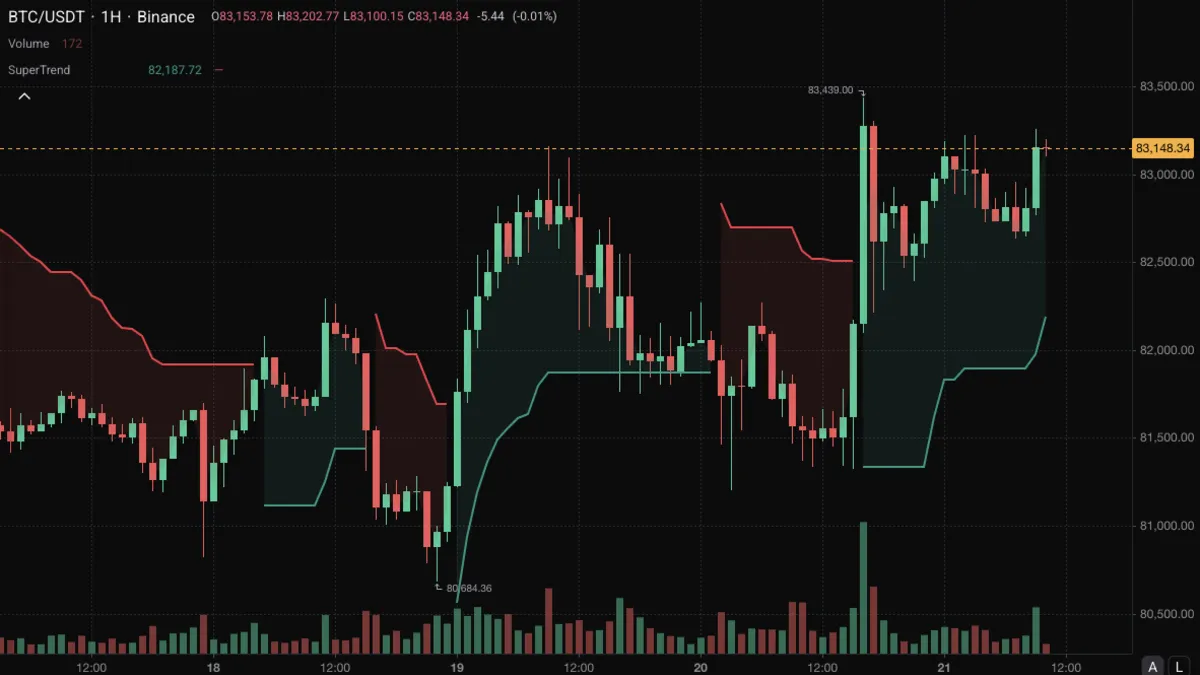
Indicator
A volatility band that sits below price in an uptrend and above it in a downtrend, and flips sides when a close breaks through it.
View indicator
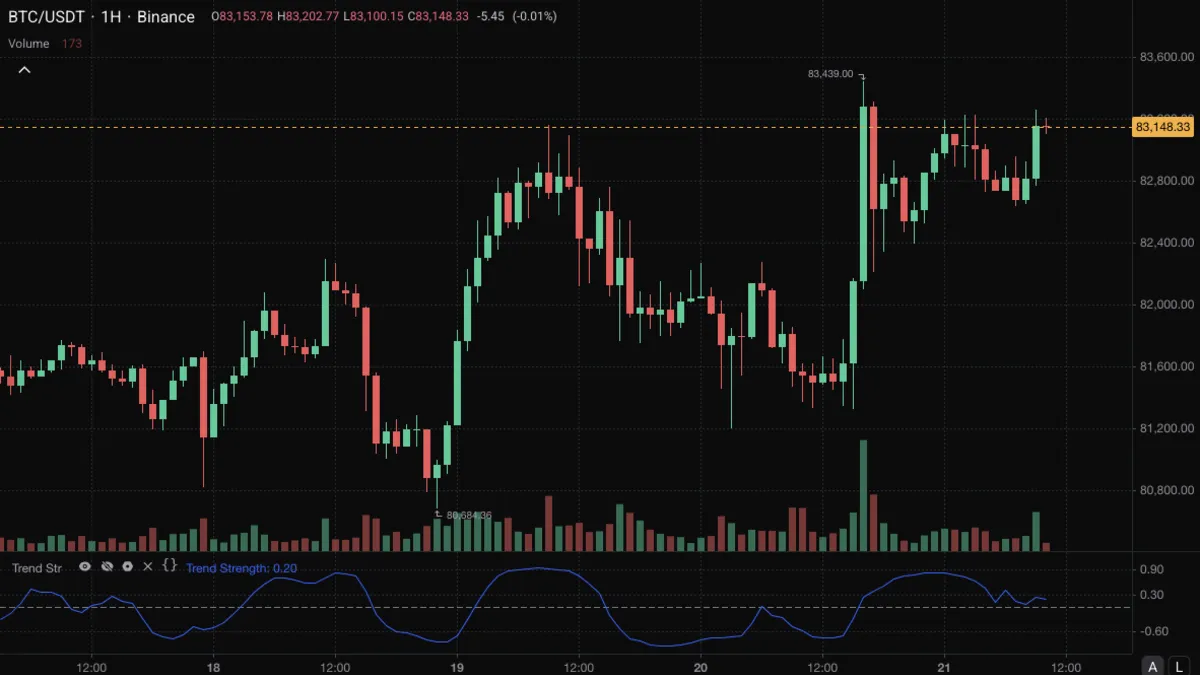
Indicator
The correlation between price and time over a window, from -1 to +1, showing how straight a move has been rather than how big it was.
View indicator
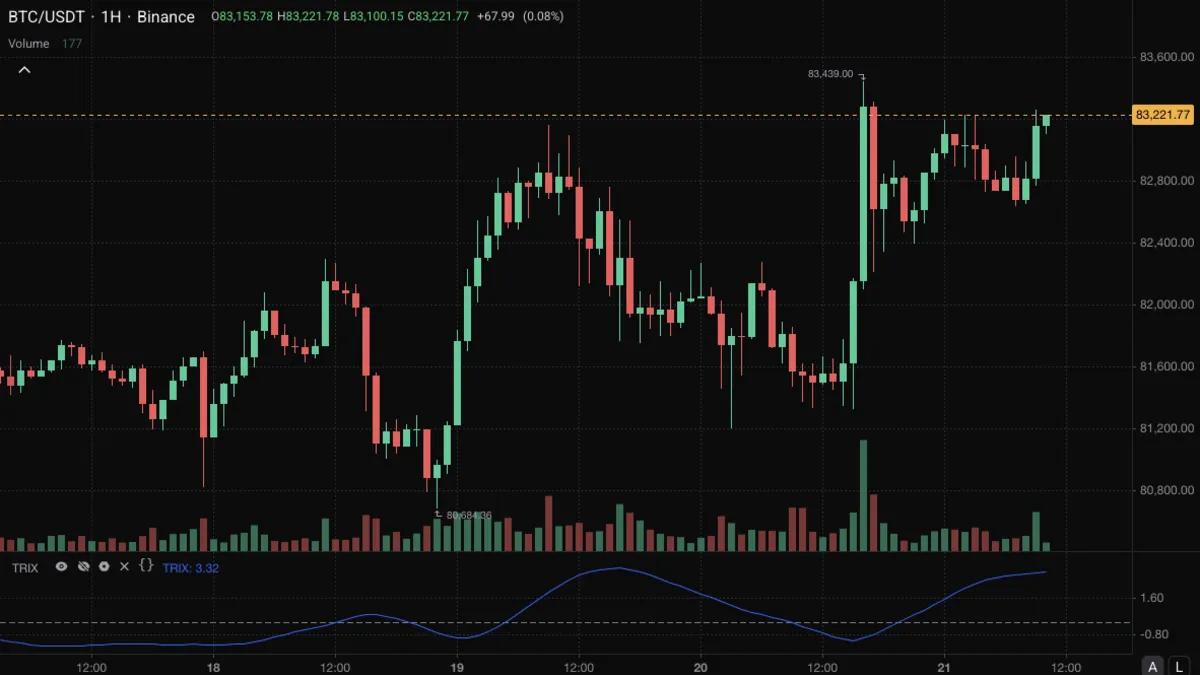
Indicator
The rate of change of a price line smoothed three times, an oscillator around zero that follows the dominant move and ignores most short swings.
View indicator
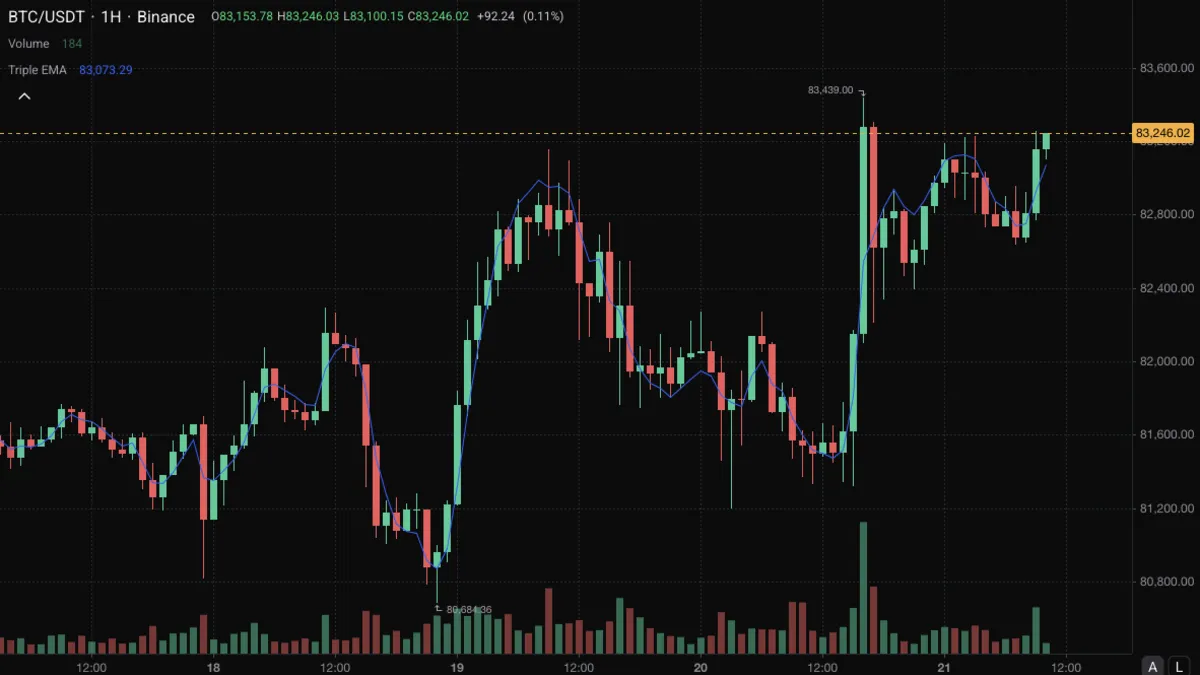
Indicator
A moving average built from three chained EMAs whose lag is corrected further than DEMA's, so it turns sooner still and overshoots more.
View indicator
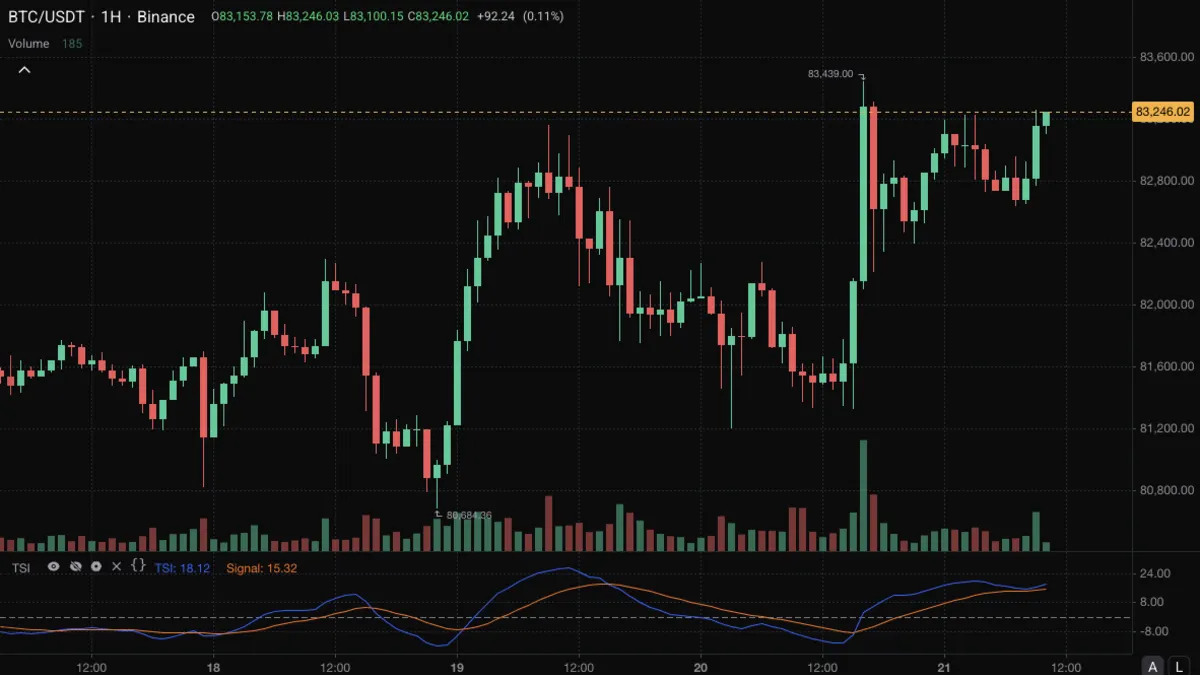
Indicator
A smoothed momentum oscillator bounded by plus and minus 100 that shows which way price has been moving and how consistently.
View indicator
Indicator
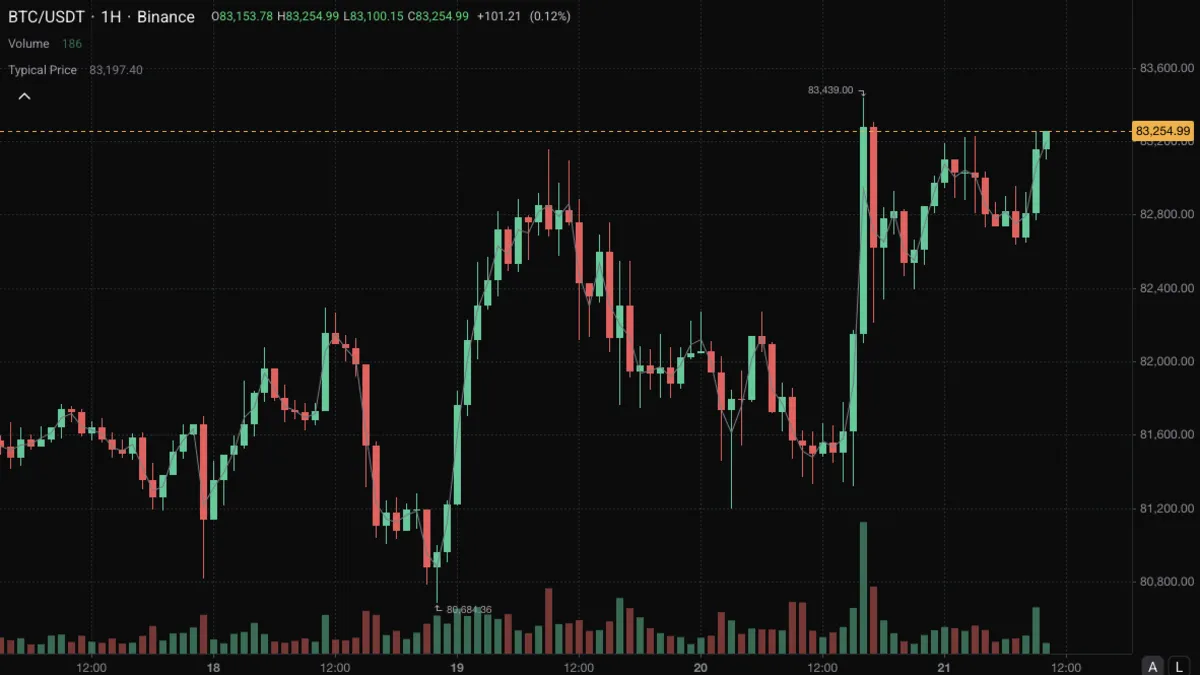
The average of each bar's high, low and close, drawn as a line, and the value that indicators such as CCI and Money Flow Index start from.
View indicator
Indicator
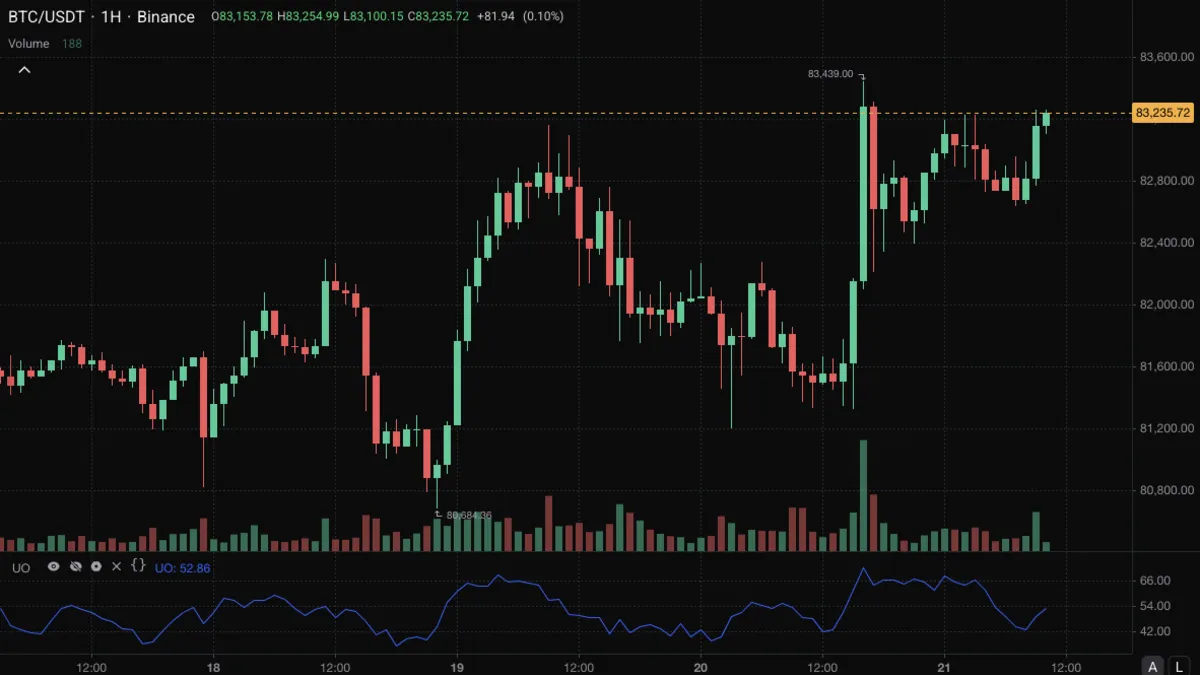
Measures buying pressure over three windows at once and blends them, weighted towards the shortest, into one 0 to 100 line.
View indicator
Indicator
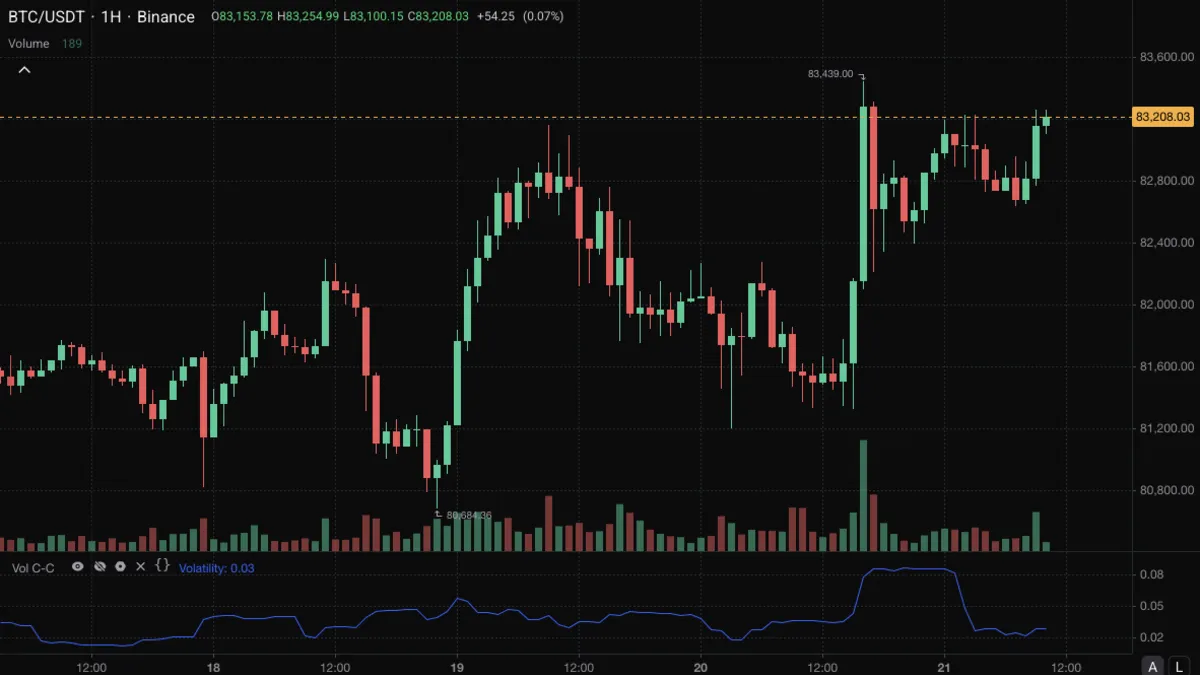
The classic annualised volatility estimate, the spread of log returns from one close to the next, scaled to a year.
View indicator
Indicator
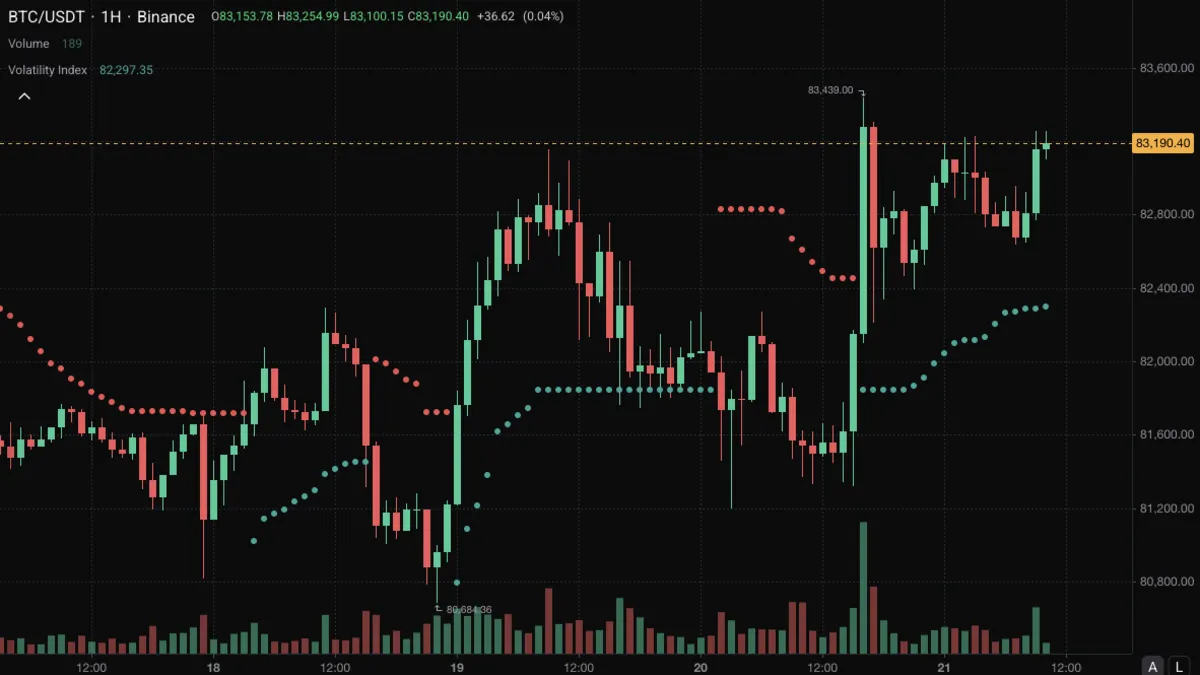
Wilder's volatility stop, a trailing level held a multiple of ATR from the best close since the last flip, which switches sides when price closes through it.
View indicator
Indicator
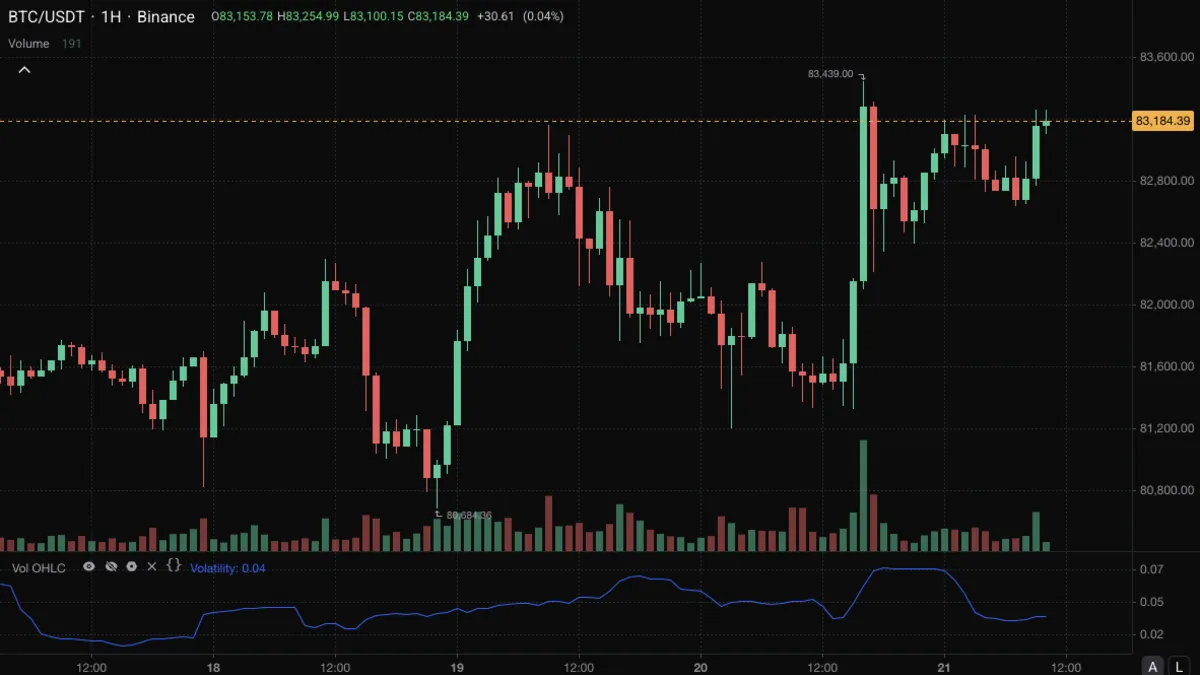
An annualised volatility estimate that uses each bar's open, high, low and close, so it reads more from each bar than a close-only measure.
View indicator
Indicator
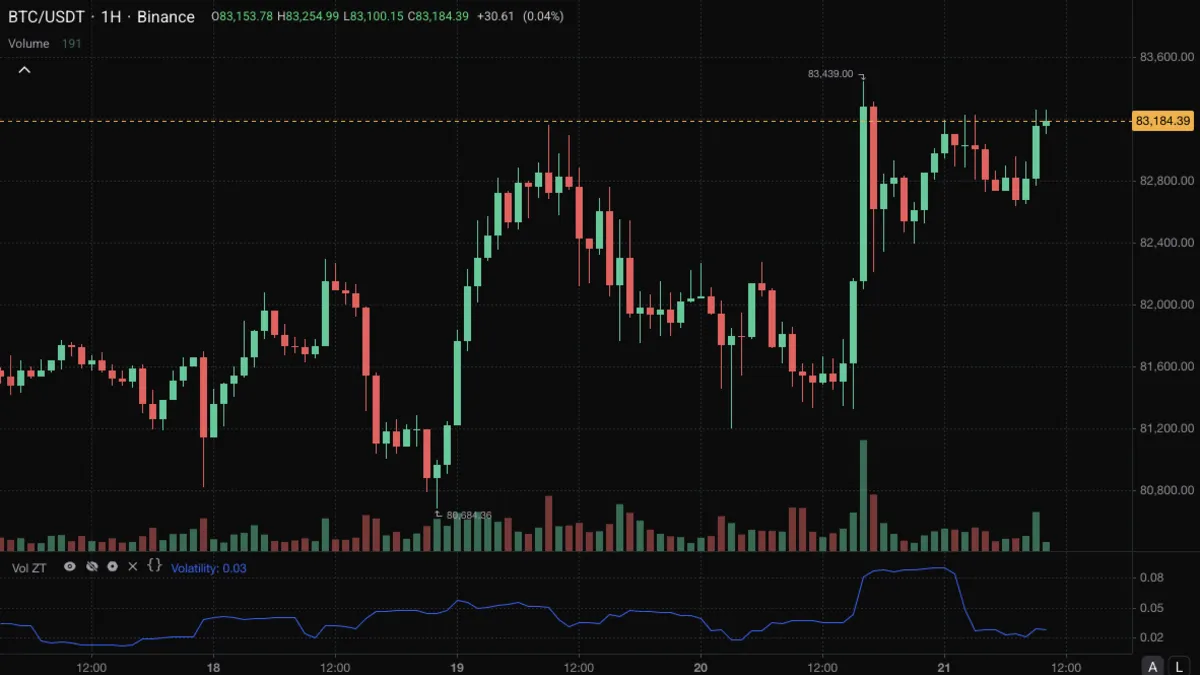
Close-to-close volatility measured around zero instead of around the window's average return, so a steady trend counts as volatility too.
View indicator
Indicator
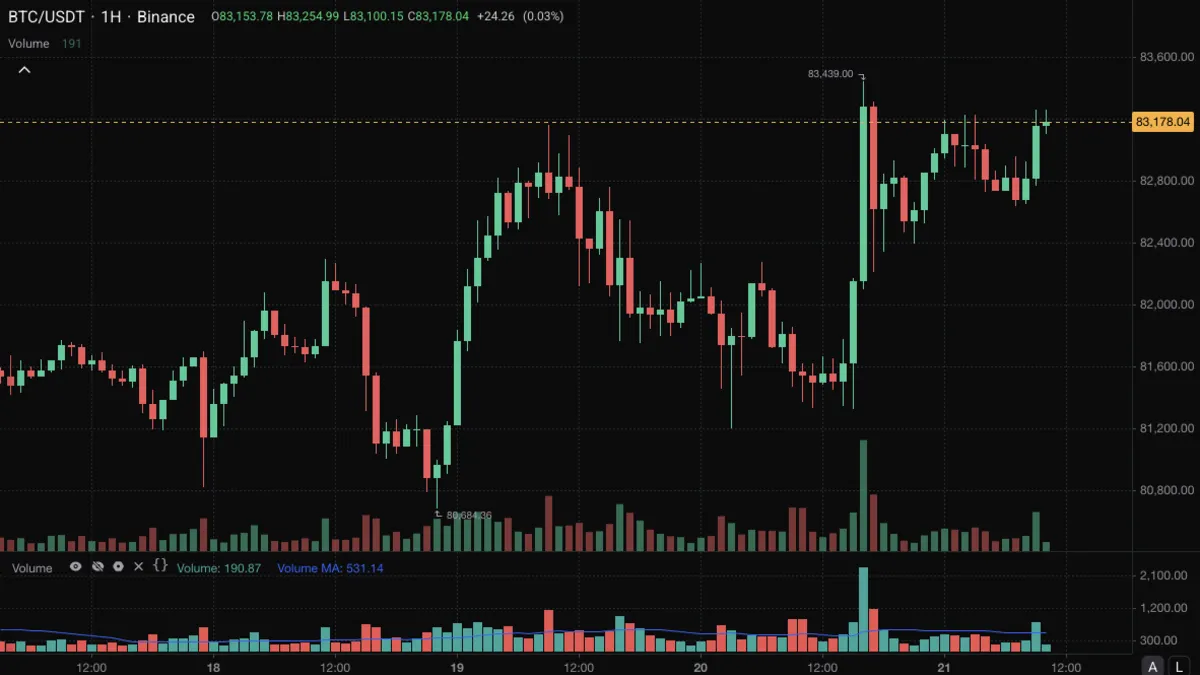
Each bar's traded volume as a column, coloured by whether the bar closed up or down, with a 20-bar average to show what normal looks like.
View indicator
Indicator
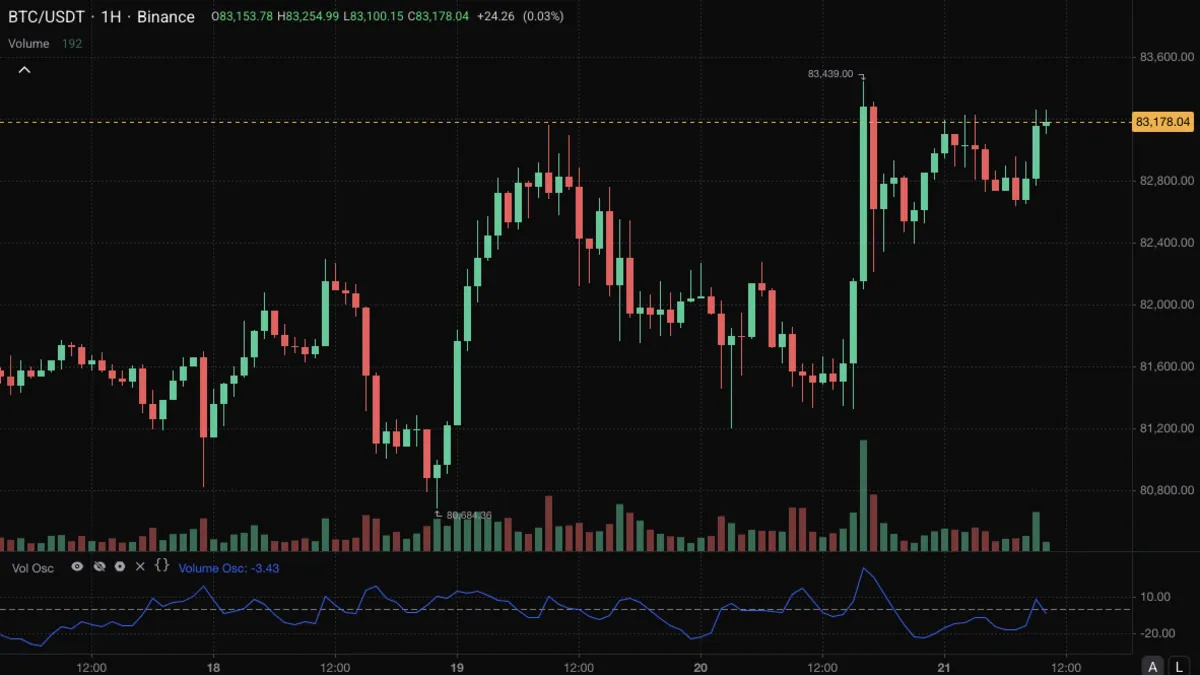
Shows how far short-term volume sits above or below its longer baseline, as a percentage, so you can see when activity is picking up or drying up.
View indicator
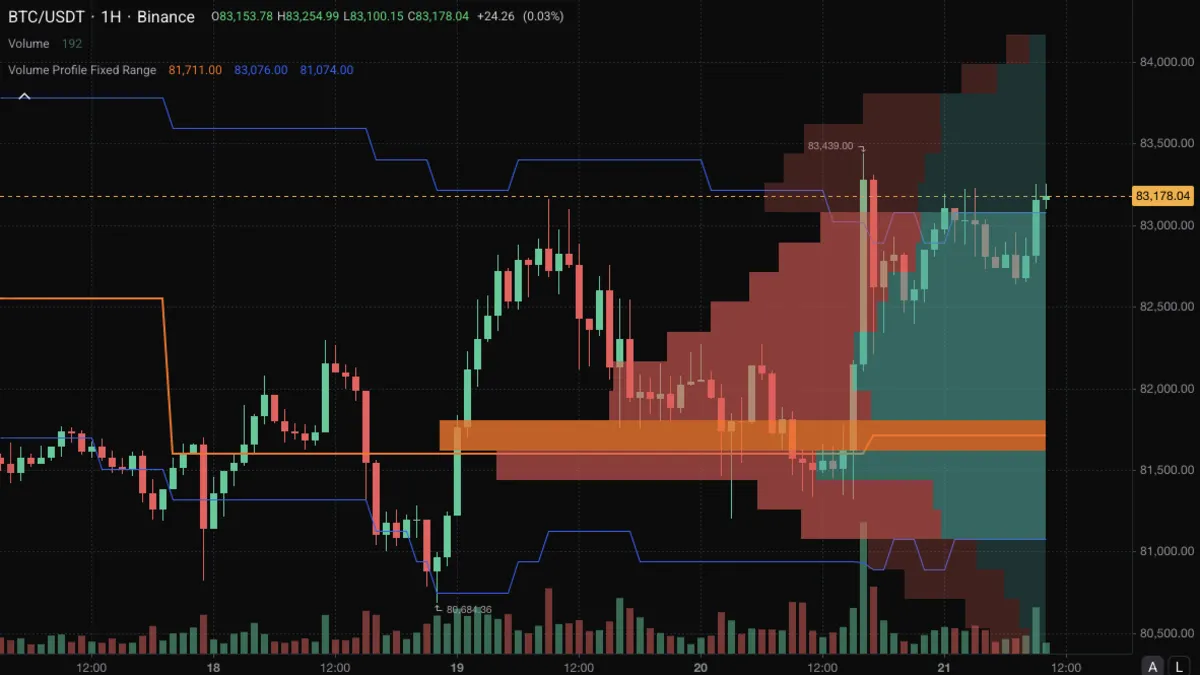
Indicator
Volume by price over the last 200 bars, drawn as horizontal rows with the Point of Control and value area, showing where the most trading was done.
View indicator
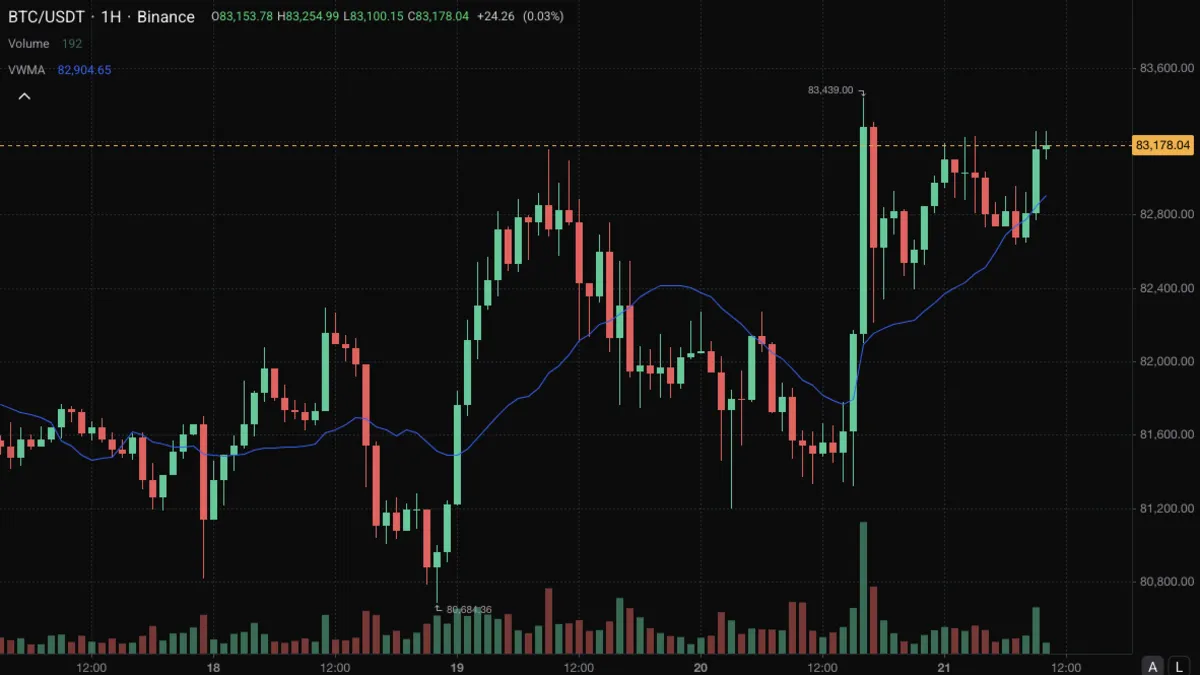
Indicator
A moving average in which each bar counts in proportion to its volume, so prices that traded heavily pull the line more than quiet ones.
View indicator
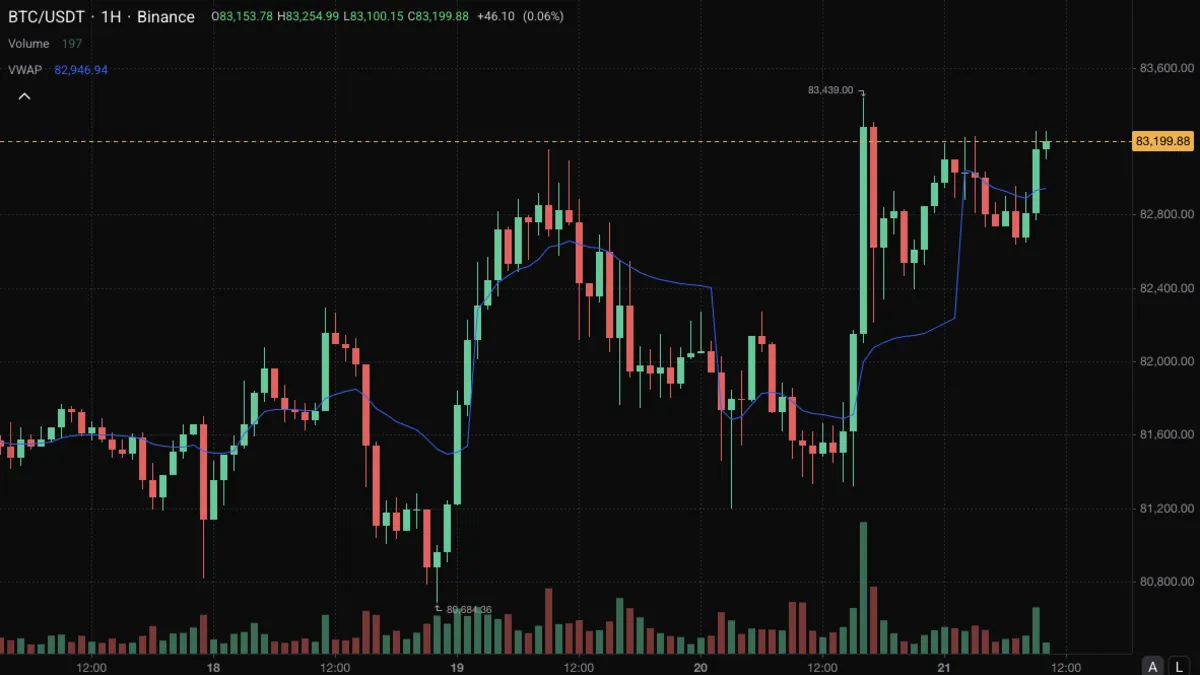
Indicator
The average price paid since the start of the UTC day, weighted by volume, used as an intraday reference for fair value.
View indicator
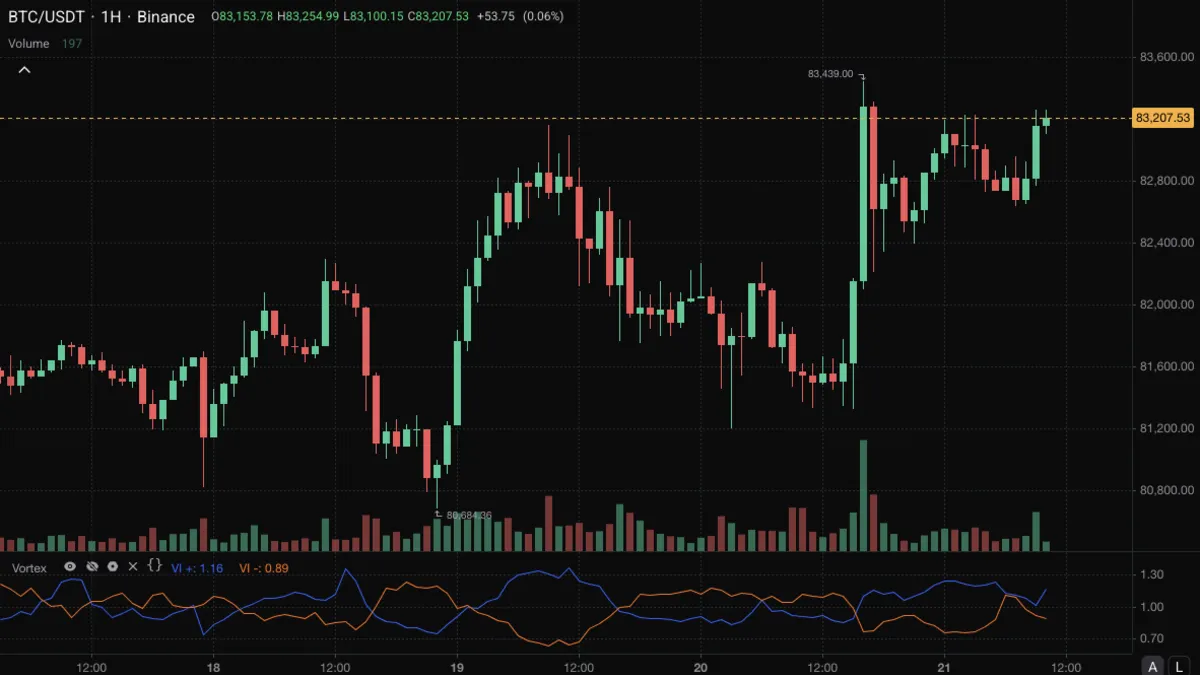
Indicator
Two lines measuring upward and downward movement across bars on a common scale, so you can see which direction has been stronger.
View indicator
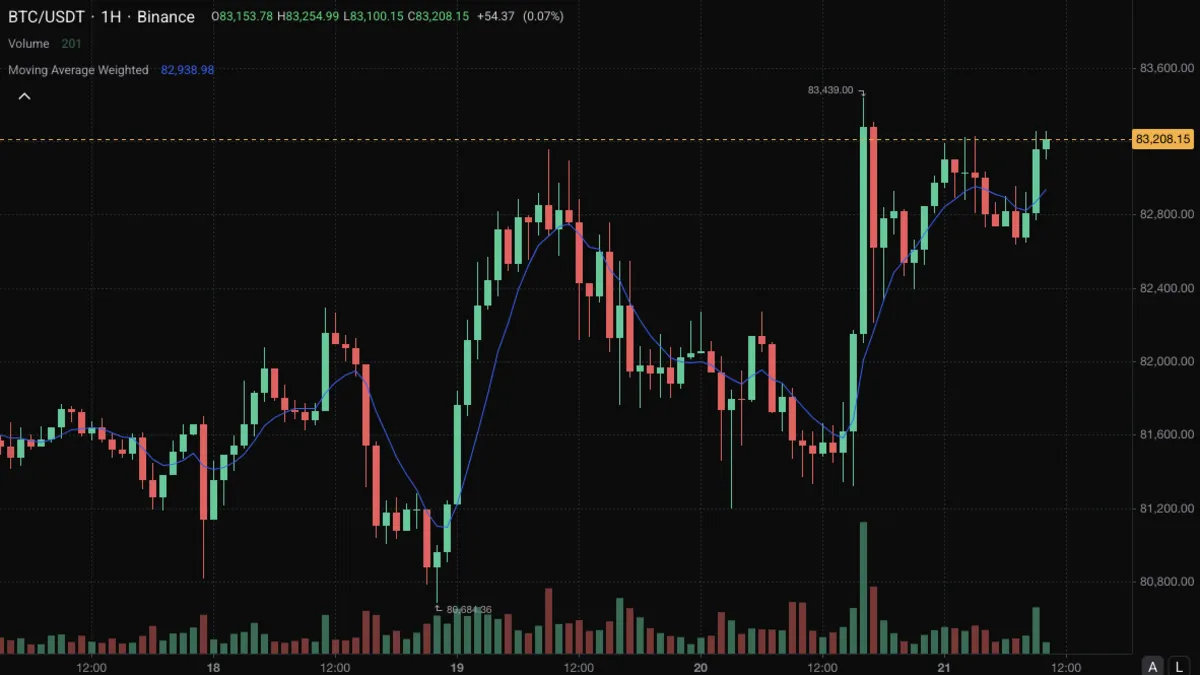
Indicator
An average that weights the newest bar most and each older bar a step less, so it turns sooner than a simple average of the same length.
View indicator
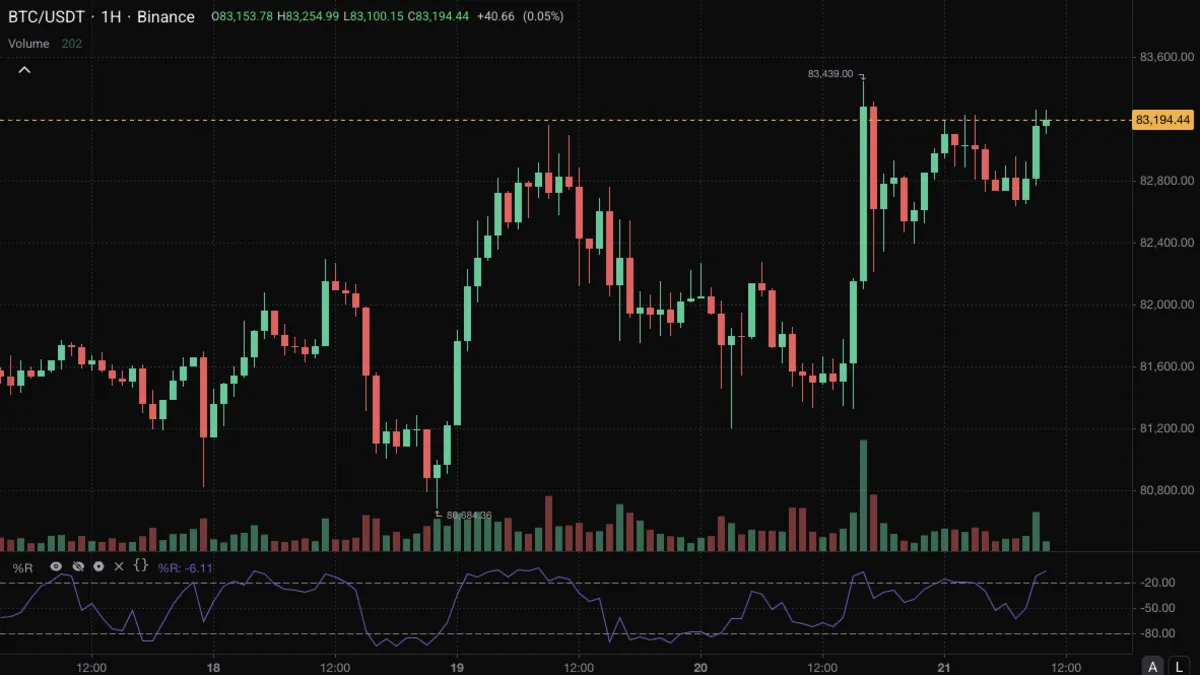
Indicator
Shows where the close sits in the recent high-low range on a scale from 0 at the top to -100 at the bottom.
View indicator
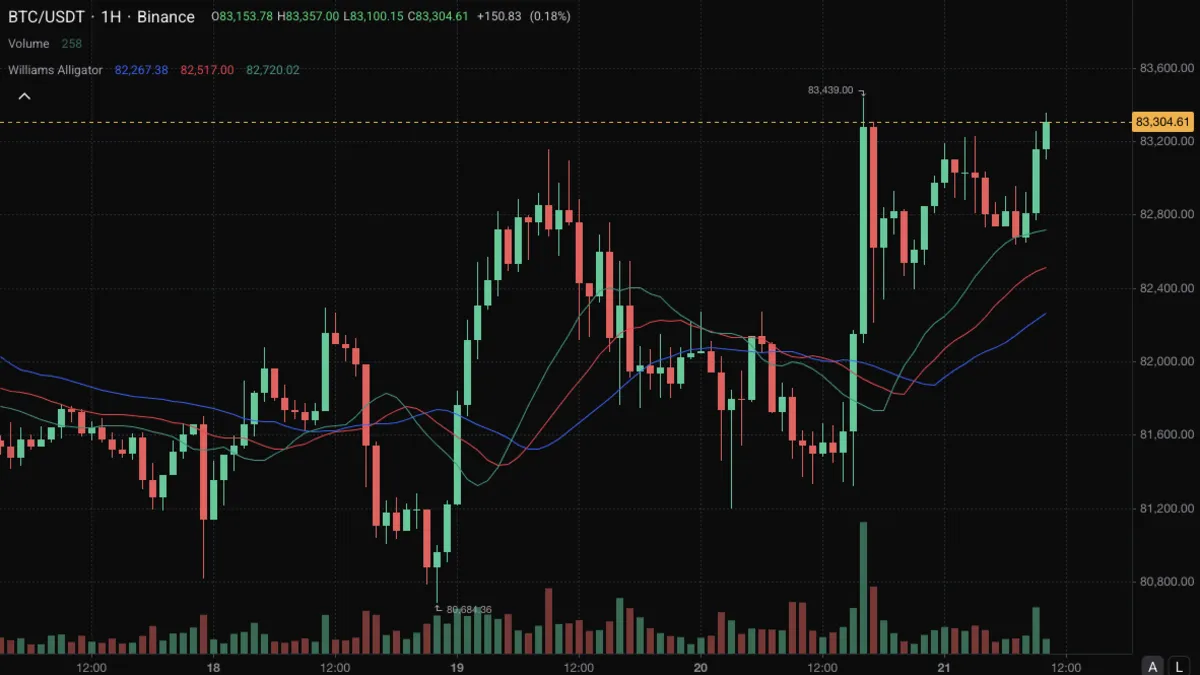
Indicator
Three smoothed averages of the median price, each shifted forward, read by whether they are tangled together or fanned out in order.
View indicator
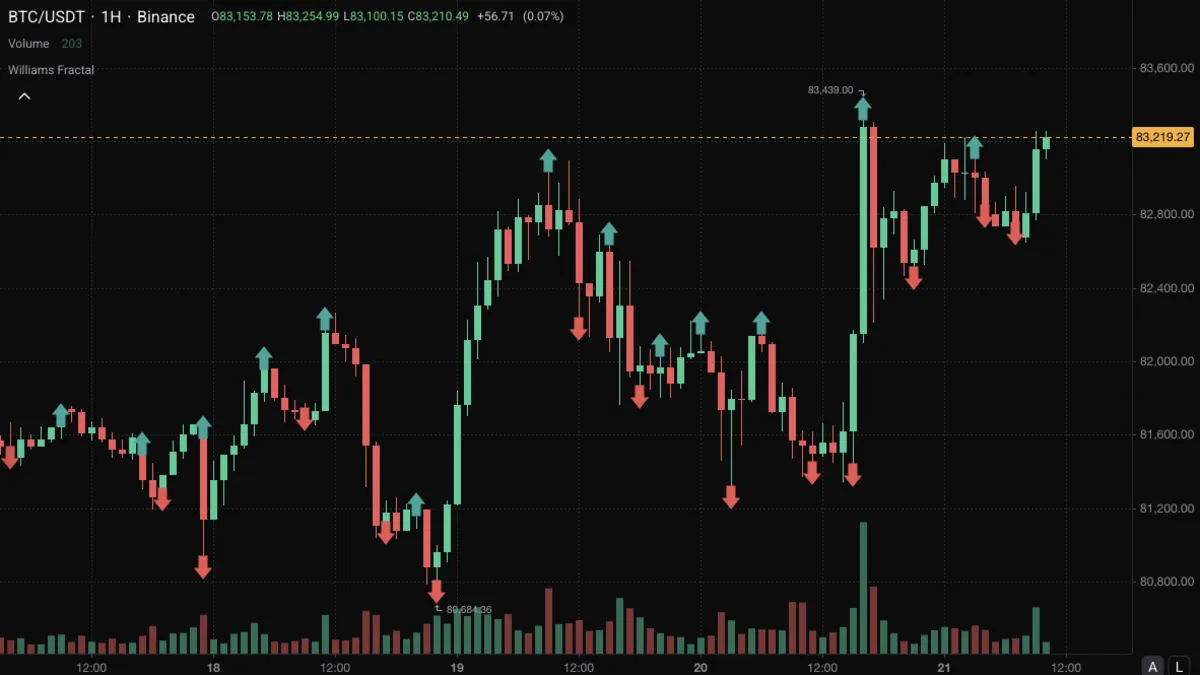
Indicator
Arrows on bars whose high or low is the most extreme of the bars either side, marking local turning points once they are confirmed.
View indicator
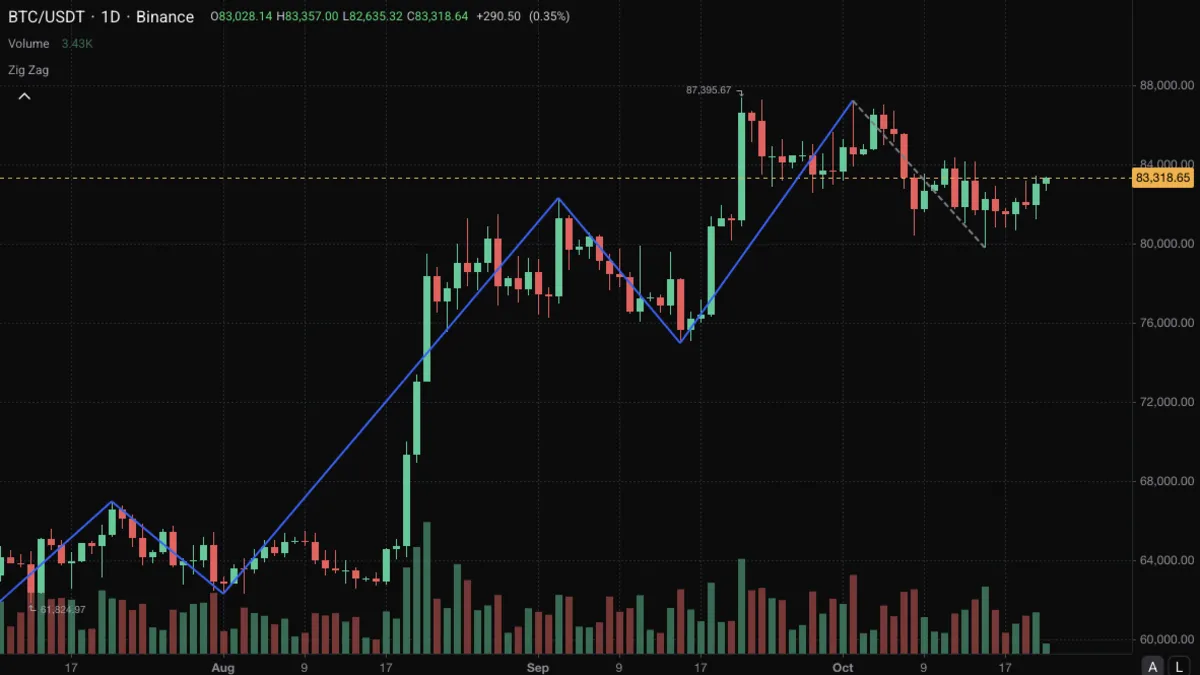
Indicator
Lines joining swing highs and lows that are at least a set percentage apart, so only the larger moves remain visible.
View indicator
Nothing matches that search
Try a different term, or clear the filters to see everything in the library.
1 strategy
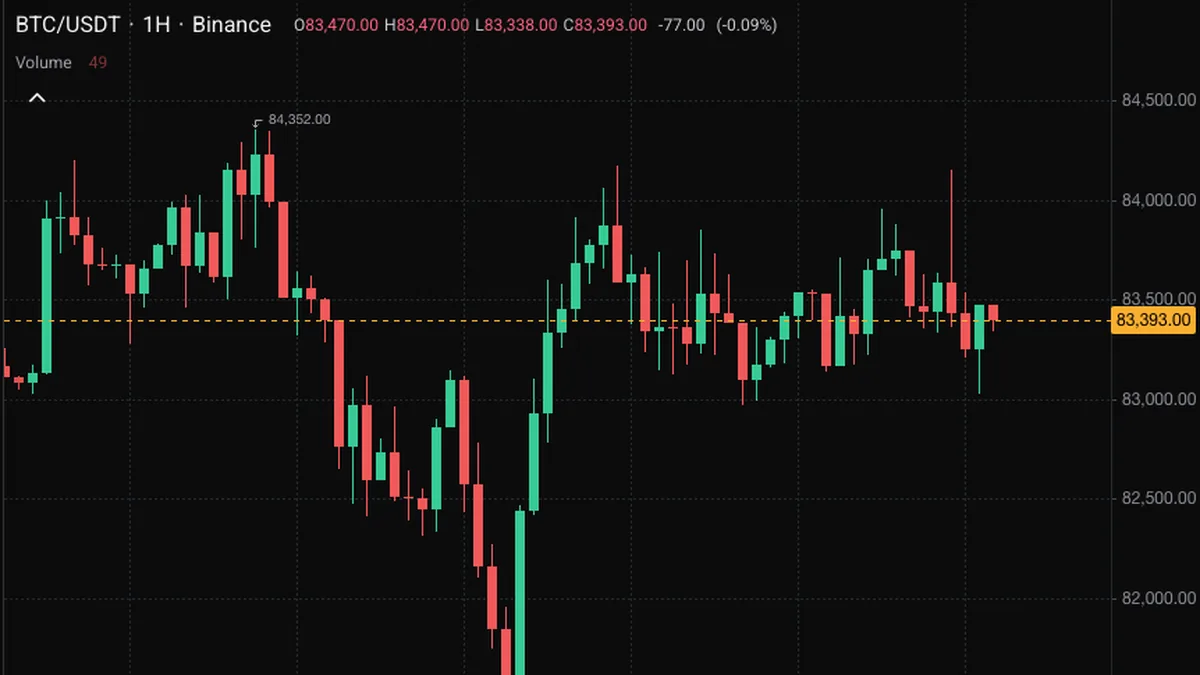
Strategy
Goes long when the 20 EMA crosses above the 50 EMA and short when it crosses below, with a stop and a target set from ATR.
View strategy
Nothing matches that search
Try a different term, or clear the filters to see everything in the library.